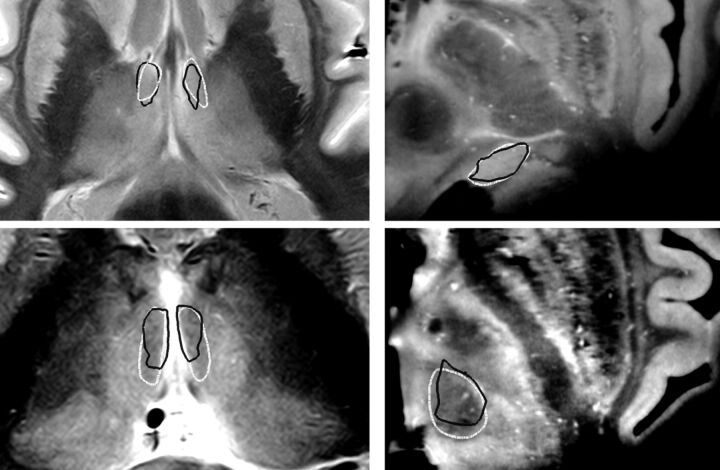
Fig 2.
Postmortem evaluation of the SSM-based target map prediction method: examples for the delineation of individual visible nuclei. The generation of thalamic nuclei was performed by using visible thalamus outlines as predictors of individual geometry. Left panels: axial sections proton attenuation–weighted MR images (brain specimen 2); right panels: axial sections, T1-weighted ex situ MR images (brain specimen 5). White outlines: manual reference nuclei borders; black outlines: SSM-based prediction of nuclei borders. Top left: anterior ventral nucleus. Top right: medial geniculate nucleus. Bottom left: mediodorsal nucleus, magnocellular part. Bottom right: centromedian nucleus.

