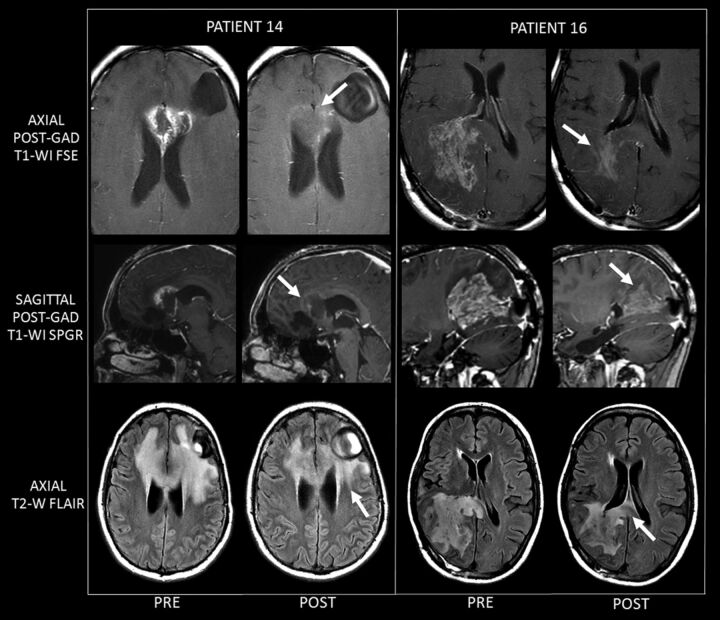
Fig 2.
Two examples (study patients 14 and 16) of MR imaging changes before and after treatment, clearly demonstrating the marked decrease in enhancement associated with a mild decrease in T2 signal abnormality related to bevacizumab therapy. For each patient, images on the left are representative of pre-SIACI bevacizumab scans, and images on the right are matched representative post-SIACI bevacizumab scans. The arrows on the postgadolinium posttreatment T1WI point to the marked decrease in enhancement after SIACI of bevacizumab. Arrows on the posttherapy T2WI FLAIR images demonstrate a significant but less dramatic decrease in abnormal T2 signal. Patient 14 received 15 mg/kg of SIACI of bevacizumab (½ left MCA, ¼ right A1 ACA, ¼ left A1 ACA). Patient 16 similarly received 15 mg/kg of SIACI of bevacizumab (½ right P1 PCA and ½ right M1 MCA).

