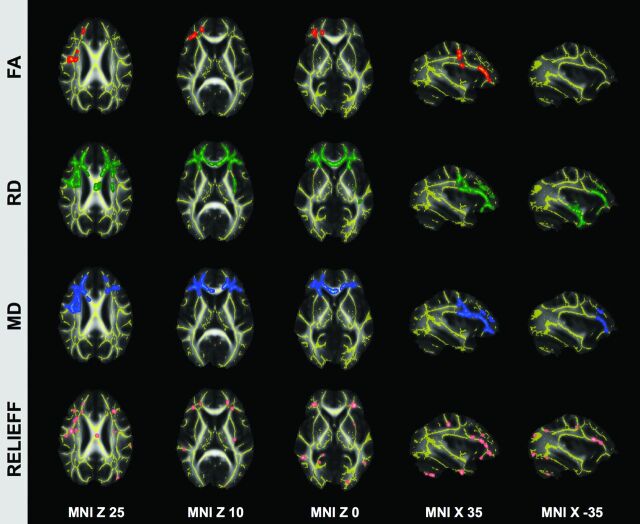
Fig 1.
TBSS analysis in PD. Patients with idiopathic PD versus Other had a spatially consistent increase in FA (red) and a decrease in RD (green) and MD (blue) in a bilateral network predominantly in the right frontal white matter. The spatially consistent difference in LD was just below threshold (not illustrated). The inverse comparison yielded no suprathreshold clusters. The most discriminative voxels (features) identified by using the RELIEFF feature-selection algorithm, which are the basis for the individual level SVM analysis, are illustrated for comparison in pink. Note the good overlap despite the fundamentally different methodology. Axial and sagittal sections are at the indicated position in Montreal Neurological Institute standard space coordinates (radiologic convention with the right hemisphere on the left-hand side). Gray indicates mean FA value; yellow, average skeleton. FA, RD, and MD clusters are TFCE corrected for multiple comparisons at P < .05. Suprathreshold voxels are enlarged by using TBSS fill (part of FSL) for illustrative purposes.

