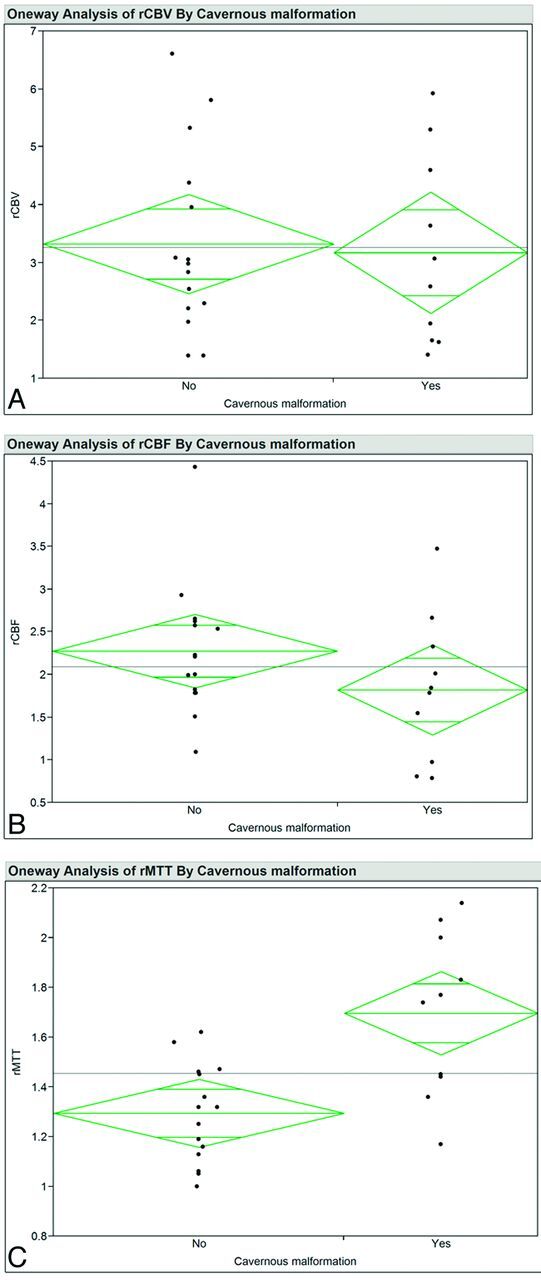
Fig 2.

Ninety-five percent mean diamond plots for rCBV (A), rCBF (B), and rMTT (C) for patients with and without cavernous malformations. The horizontal line is the grand mean. The heights of the diamonds represent the 95% confidence intervals, and the widths of the diamonds are proportional to the sample sizes. If the overlap line of one diamond is closer to the mean of another diamond than is the overlap line of that diamond, there is no difference between the groups.
