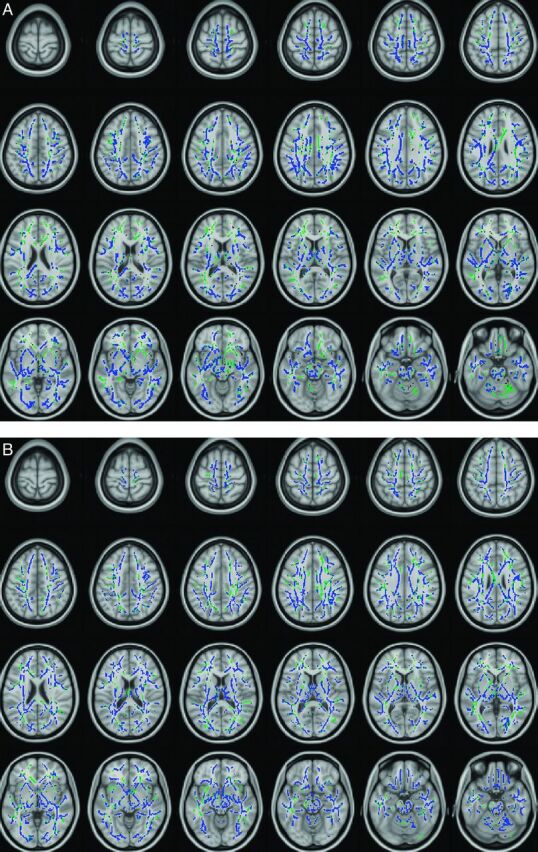
Fig 3.

Results of tract-based spatial statistics analysis revealed significant differences between the tuberous sclerosis complex and control groups in FA (A) and axial diffusivity (B) maps, with overlaid mean value skeleton. Regions of the skeleton in green represent areas of no significant differences in values between the tuberous sclerosis complex group and the control subjects. Regions in blue are areas in which the value was significantly lower in the tuberous sclerosis complex group.
