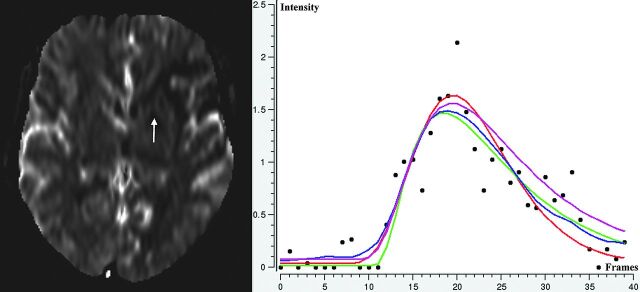
Fig 1.
Selected section from a PWI dataset (left) and concentration time curve (black dotted) for a location within the perfusion lesion (arrow) with fitted hemodynamic model curves: γ-variate model (red), local density random walk model (green), log-normal model (magenta), and reference-based linear curve fit model (blue).

