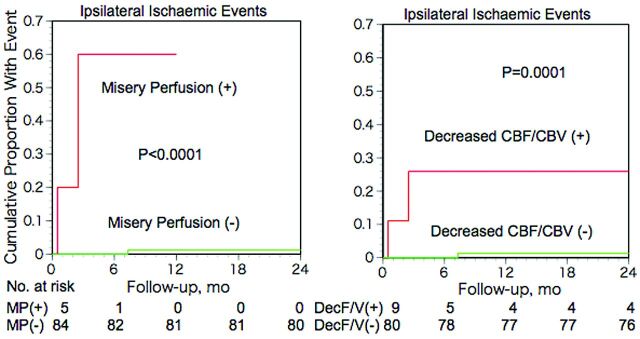
Fig 3.
Kaplan-Meier cumulative failure curves for ipsilateral ischemic events in patients with and without misery perfusion (left) or decreased CBF/CBV (right). The number of patients who remained event-free and available for follow-up evaluation during each 6-month interval is shown at the bottom of the graph.

