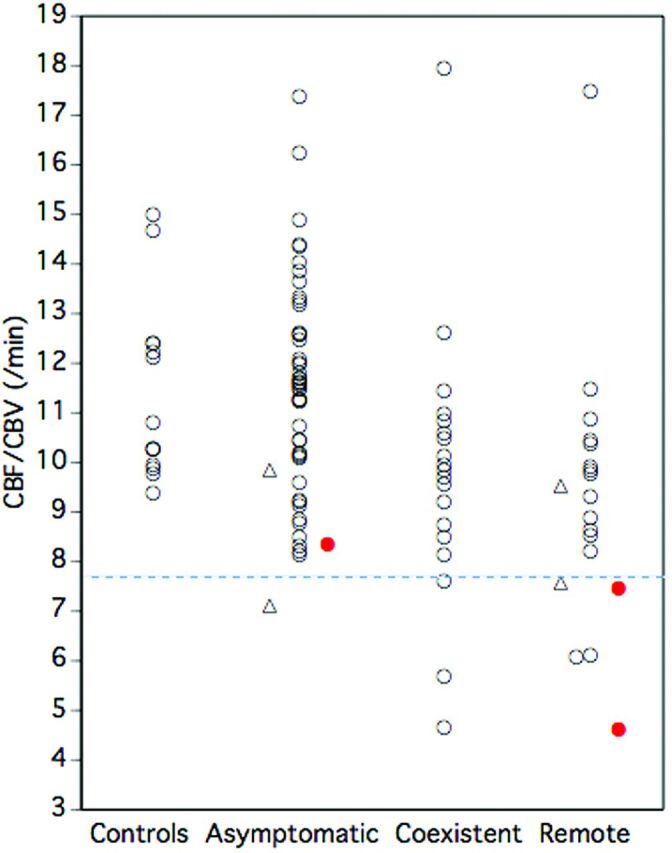
Fig 4.

Relationship between decreased CBF/CBV and ischemic events. Closed circles (red) indicate patients with ischemic events. A dashed line (blue) denotes the lower 95% limit defined in healthy controls. Triangles indicate patients who underwent bypass surgery.
