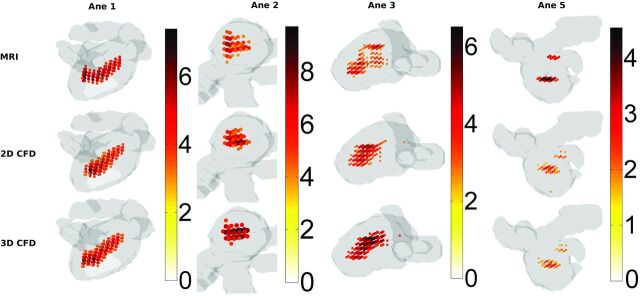
Fig 3.
Singular-energy magnitude and location at peak systole in aneurysm volumes (gray) of aneurysm 1, 2, 3, and 5 for 3D PC-MR imaging; CFD with inflow boundary conditions obtained from 2D PC-MR imaging; and CFD with inflow boundary conditions obtained from 3D PC-MR imaging. For visualization purposes, only the areas with singular energy above half the maximum value are indicated.

