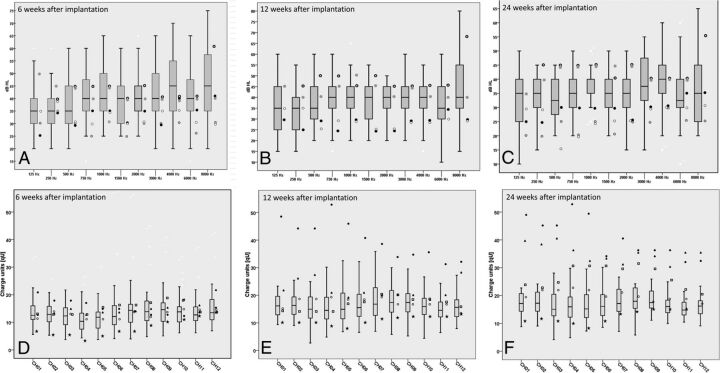
Fig 5.
A–C, The boxplots represent the hearing thresholds of the control group. The hearing thresholds of the 5 patients with electrode dislocation are added as points beside the boxplots. Frequency-specific hearing thresholds of controls at 6 weeks after implantation (A), at 3 months after implantation (B), and at 6 months after implantation (C). D–F, The boxplots show the charge units of maximum comfortable loudness levels. The symbols beside the boxplots show the 5 patients with electrode dislocation. The charge units after 6 weeks (D), 12 weeks (E), and 24 weeks (F).

