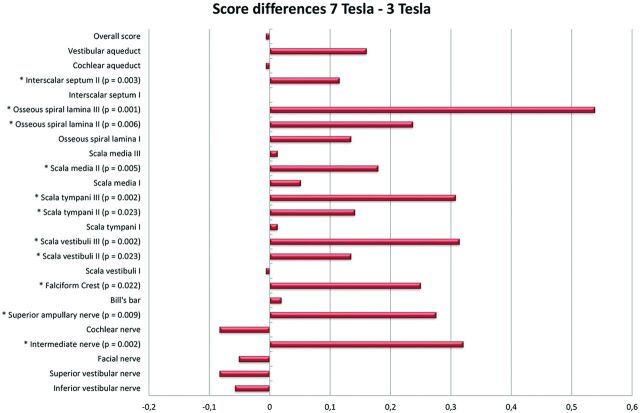
Fig 1.
Mean differences in scoring of anatomic structures depicted at 3T and 7T. The bars on the right side of the zero line indicate differences in favor of the 7T images. The bars on the left side indicate differences in favor of the 3T images. The structures showing significant differences are marked with an asterisk on the left, and P values are mentioned if significant.

