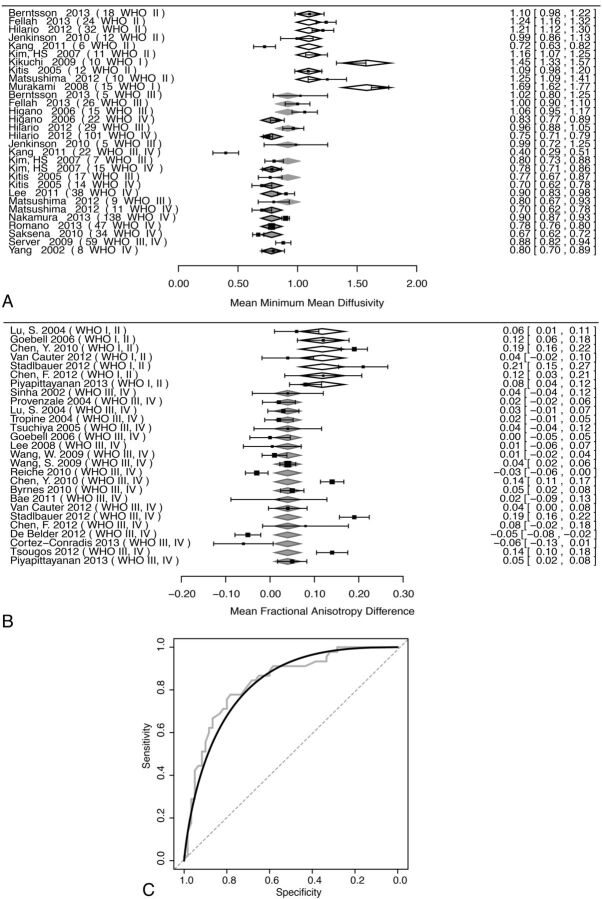
Fig 1.
Effects of tumor grade on minimum mean diffusivity and Δ fractional anisotropy. Moderator analysis was performed (A and B) with respect to tumor grade. In forest plots (A and B), the left column indexes each study by lead author and publication year, with the WHO tumor grade of the lesions in parentheses. WHO grade category means are shown by diamonds, with relative width corresponding to the standard error. The right column provides numeric mean values, with confidence intervals in brackets for each study. Pooled random-effects values are provided at the bottom of each plot. A, The forest plot of minMD and effect of WHO tumor grade are shown. Open diamonds indicate WHO II; light-gray diamonds with gray borders, WHO III; dark gray diamonds with black borders, WHO IV. B, The forest plot of ΔFA is shown. Open diamonds indicate WHO I, II; light gray diamonds with gray borders, WHO III, IV. C, An ROC plot of patient-level data for minMD is shown. Gray step curve indicates actual data; black curve, binormal smoothed curve; dashed gray line, 50:50 line.

