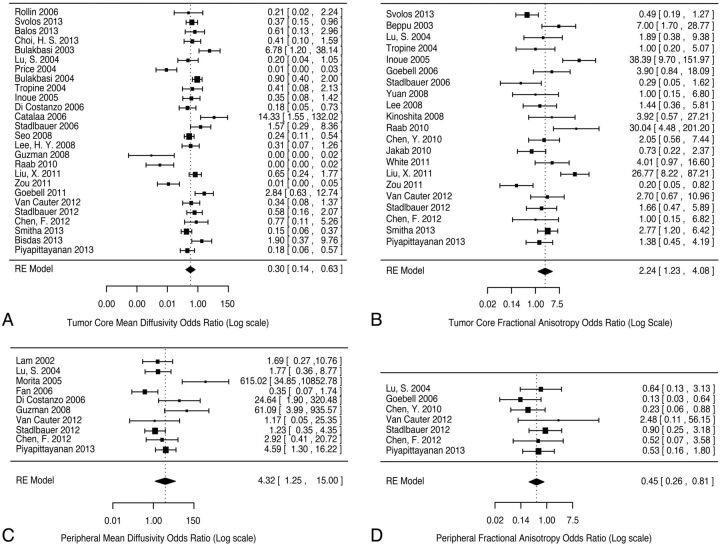
Fig 2.
Forest plots of mean diffusivity and fractional anisotropy in the tumor core and peripheral region of signal abnormality, comparing differences between low-grade and high-grade categories (moderator analysis was not performed). The standardized mean difference between high-grade and low-grade lesions was converted to odds ratios as a measure of effect size. Mean diffusivity in the tumor core (A) and peripheral region (B) with fractional anisotropy in the tumor core (C) and peripheral region (D) are shown. For each forest plot, the left column indexes each study by lead author and publication year. The right column provides odds ratios, with confidence intervals in brackets for each study. Pooled random-effect odds ratios are provided at the bottom of each plot.

