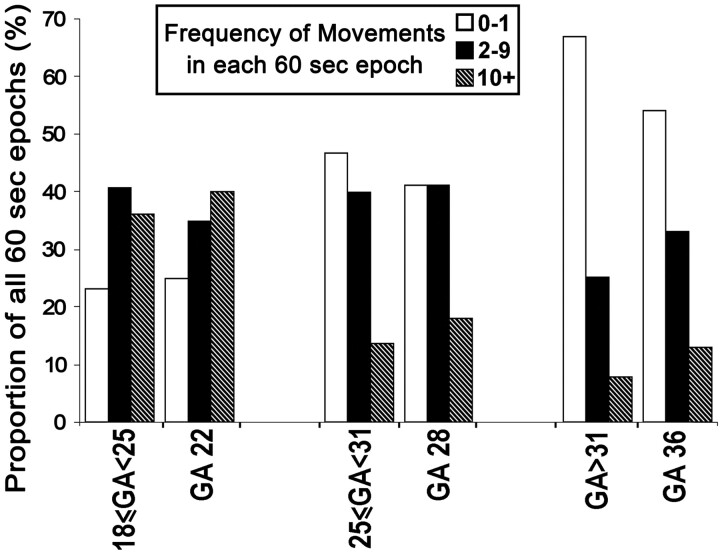
Fig 6.
Graph shows overall activity levels in long-duration cine acquisitions compared with pooled shorter duration data from the corresponding age groups. The results show that there are similar proportions of 60-second epochs that contain each level of motility between each age group and the corresponding long acquisition.

