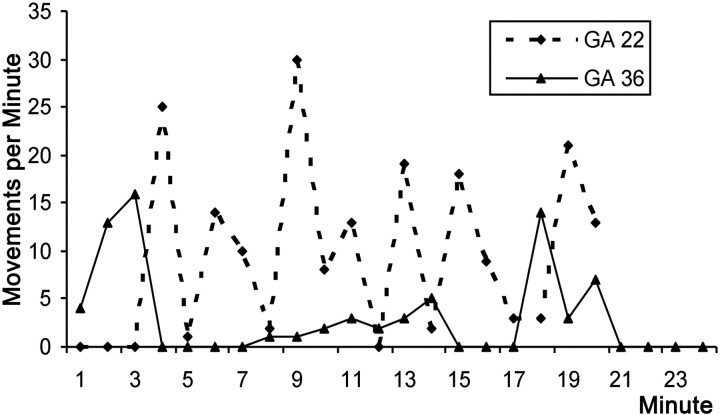
Fig 7.
Graph shows activity levels during 20 minutes. Data from the long cine acquisitions from the fetuses at GA 22 (dashed line) and GA 36 (solid line) are shown. There are notable differences in the maximum frequency of movements. Also the behavior of the GA 36 weeks' fetus appears more ordered with more clearly defined periods of activity and inactivity than the GA 22 weeks' fetus.

