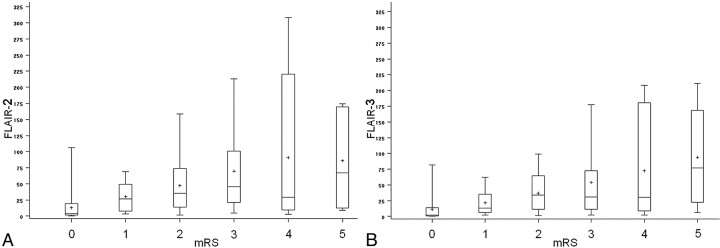
Fig 3.
FLAIR volumes (either FLAIR-2 in part A or FLAIR-3 in part B) according to disability assessed by mRS. The cross inside the box represents the mean. The middle bar is the median. Upper and lower extremities of the box are Q1 and Q3, respectively. Maximum and minimum values are represented by extreme lines. Larger FLAIR volumes are associated with worse clinical prognosis with a similar tendency by using either FLAIR-2 or FLAIR-3.

