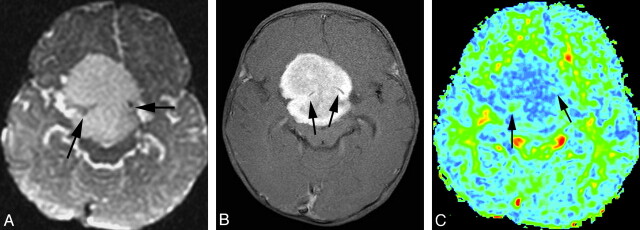
Fig 2.
A, T2-weighted (b=0) MR image shows a grade II glioma. B, Postgadolinium axial T1-weighted image shows whole-tumor contrast enhancement. C, FA map shows tumor FA with a homogeneous blue hue. The darker blue (cool color tone) represents low FA and the red and yellow (warm color tones) correspond to high FA. Region-of-interest selection for FA measurement is based on visually inspecting the hue. Maximum FA, minimum FA, FA range, and maximum SD are 0.145, 0.061, 0.084, and 0.0411, respectively. Arrows point to arteries.

