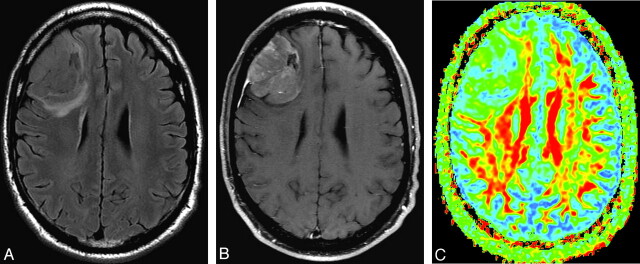
Fig 4.
A, FLAIR image shows a grade IV glioma. B, Postgadolinium axial T1-weighted image shows inhomogeneous tumor contrast enhancement. C, FA map shows that the tumor has a warmer color tone (dark green and scattered yellow and red) compared with that in Figs 2 and 3. Maximum FA, minimum FA, FA range, and maximum SD are 0.346, 0.0834, 0.2626, and 0.11, respectively. Each value of the measurements for this grade IV tumor is correspondingly larger than that for the grade III tumor shown in Fig 3.

