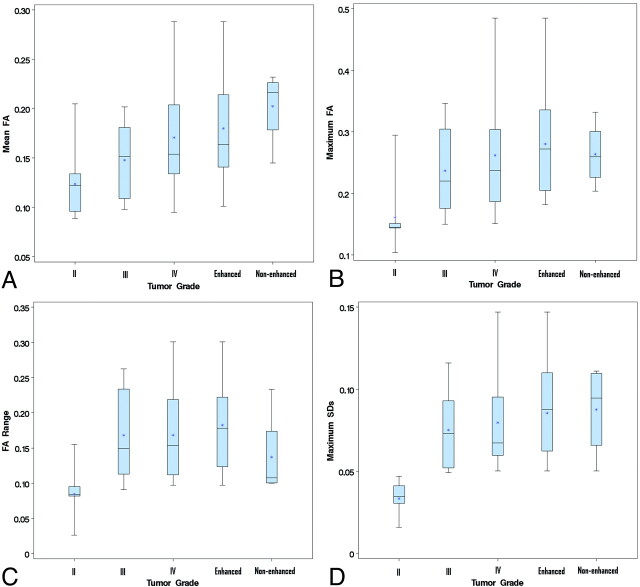
Fig 5.
Graphs show the comparisons of FA measurements among tumor grades and components. Boxes represent the range between the first and third quartiles. Median values are shown as horizontal lines within each box. Asterisks indicate the mean value in each group. Vertical lines extending from the top and bottom of each box terminate at the maximum and minimum values, respectively. A, Mean FA for grade II tumors is lower than that for grade IV tumors, nonenhanced components, or enhanced components, respectively, with a significant or approaching significant difference. B, The maximum FA for grade II tumors is significantly lower than that for grade III, IV, or components. C, The FA range for grade II tumors is significantly lower than that for grade III, IV, or enhanced components. D, The maximum SD for grade II tumors is significantly lower than that for grade III, IV, or components. For all measurements, there was no significant difference among any pair of grade III, IV, or components.

