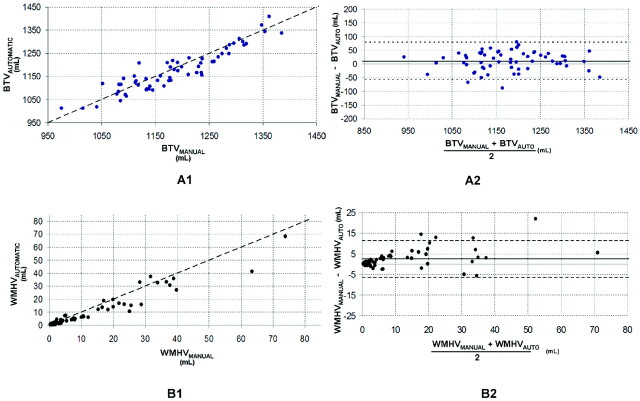
Fig 3.
Comparison between manual and automatic volumes. A1 and B1, The plots of automatic versus manual for BTV and WMHV. The oblique dashed line represents the equality line. A2 and B2, The corresponding Bland-Altman plots for BTV and WMHV. The horizontal dashed lines are the confidence intervals of the difference between manual and automatic volumes.

