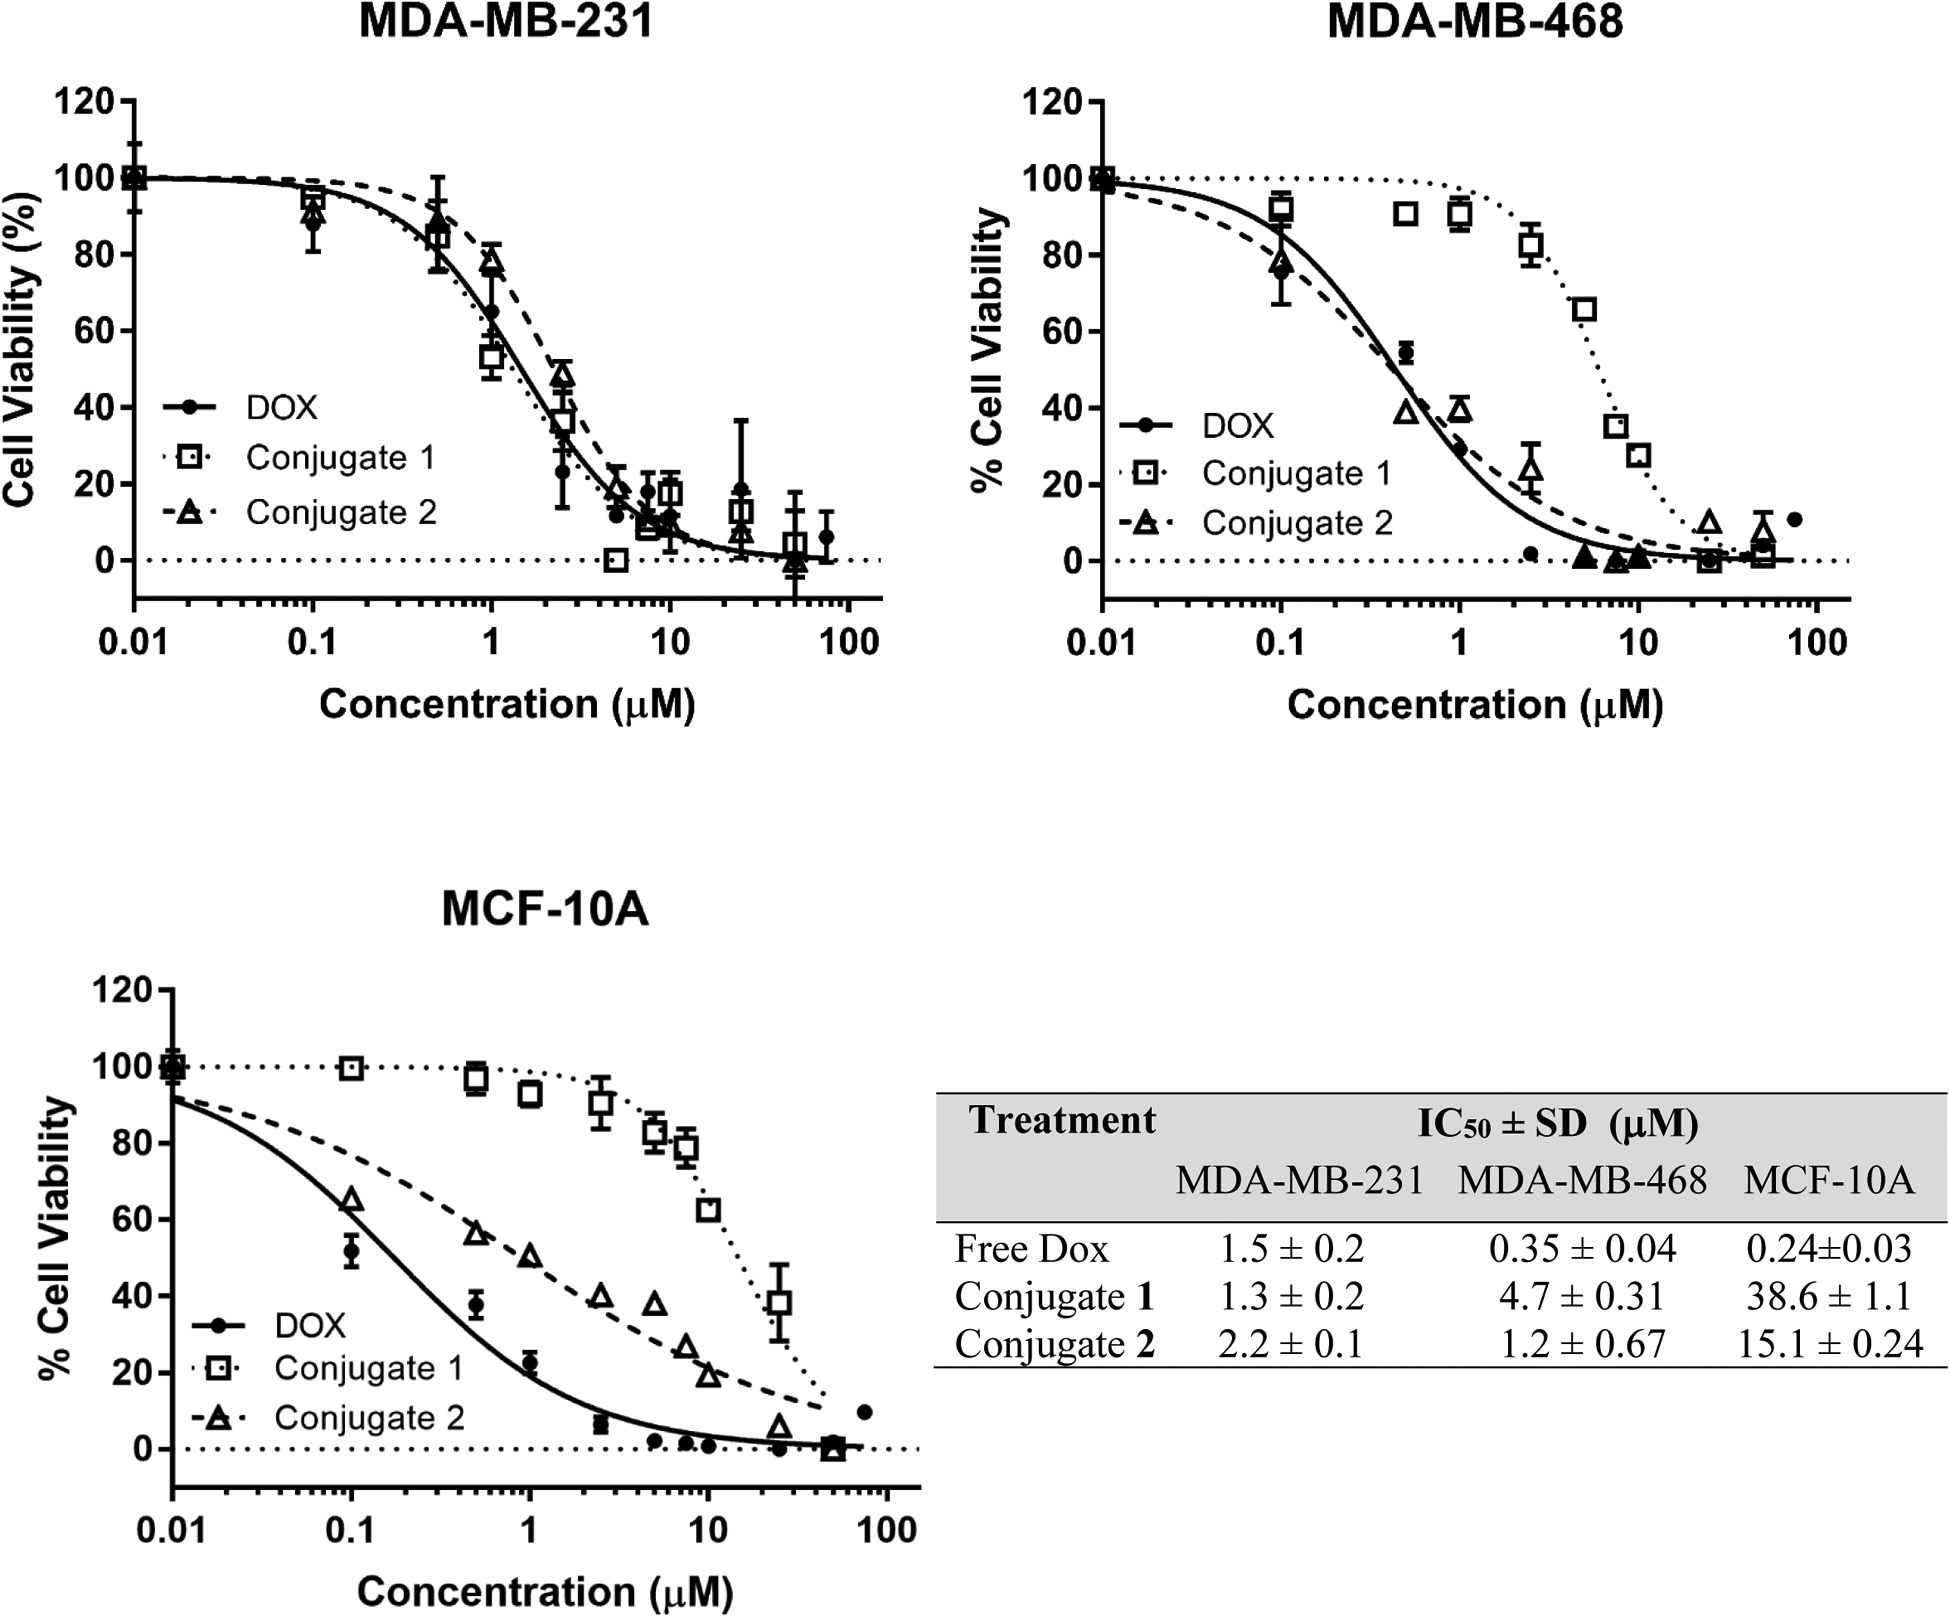
Figure 4.

Cytotoxicity of PDCs 1 and 2 using MTT assay. The percent cell viability is plotted against conjugate or Dox (control) concentration and the data are fitted using non-linear fit of normalized data to obtain IC50 values using GraphPad Prism 7.04. The plots show a representative experiment for each cell line used, namely, MDA-MB-231, MDA-MB-468, and MCF-10A. The table lists corresponding mean IC50 values and the standard deviation for Dox, conjugate 1 and conjugate 2 for the three cell lines. Each experimental point was done in triplicates and the experiment was repeated once. The horizontal dotted line at 0% cell viability serves as a baseline.
