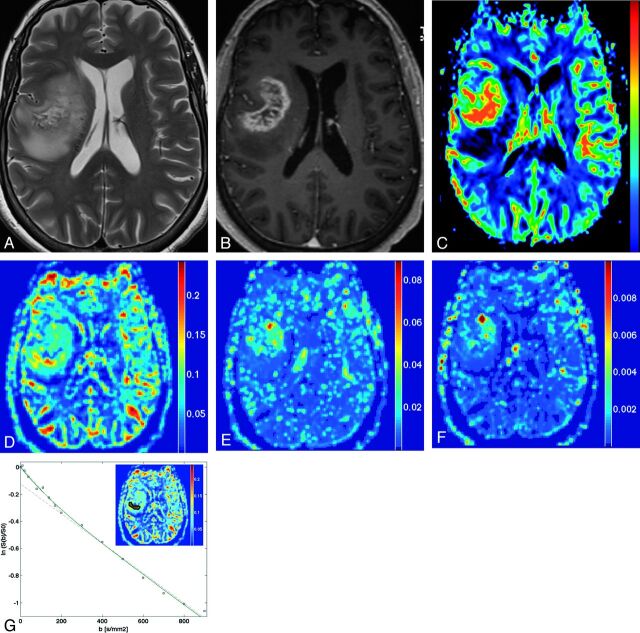
Fig 1.
A–C, Glioblastoma multiforme involving the paraventricular region of the right frontal lobe seen on axial T2-weighted, T1-weighted postgadolinium, and DSC CBV. D–F, IVIM parametric maps f, D*, and fD* (scale bars: f = unitless; D*, fD* = mm2s−1). G, Logarithmic plot of signal-intensity decay as a function of b of the region of interest of maximal perfusion fraction, with the corresponding biexponential fit.

