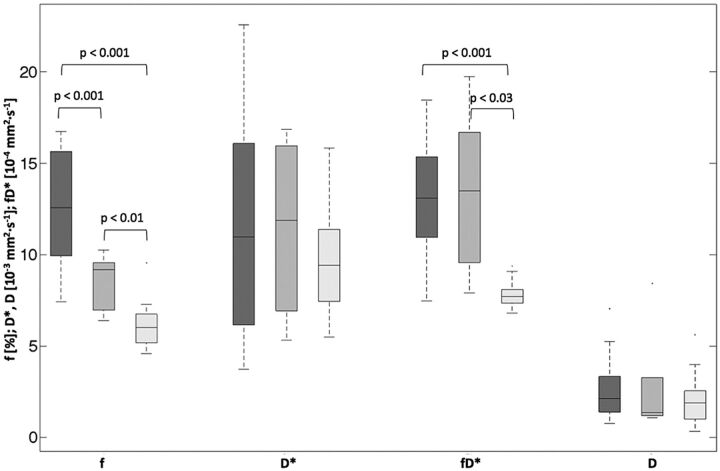
Fig 3.
Box-and-whisker plot (median, 25th and 75th percentiles, minimum, maximum, and outliers) of f, D*, fD*, and D, as measured in ROIs of the maximum perfusion fraction. Dark gray indicates high-grade tumors; medium gray, low-grade tumors; light gray, contralateral control region of both high- and low- grade. P values are indicated when <.05.

