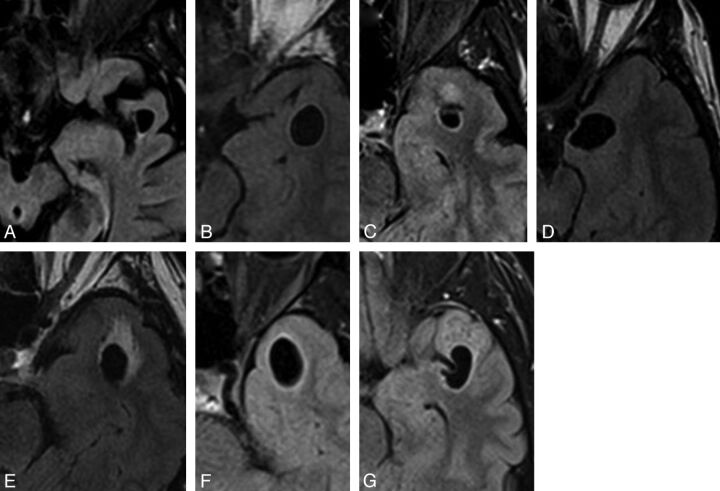
Fig 2.
Selected axial FLAIR images of left-sided lesions within the anterior superior temporal gyrus as identified in case 3 (A), 4 (B), 5 (C), 6 (D), 11 (E),13 (F), and 15 (G). All lesions were located adjacent to the SAS. Again, the images illustrate the variability in the degree of surrounding signal change.

