Figure 1.
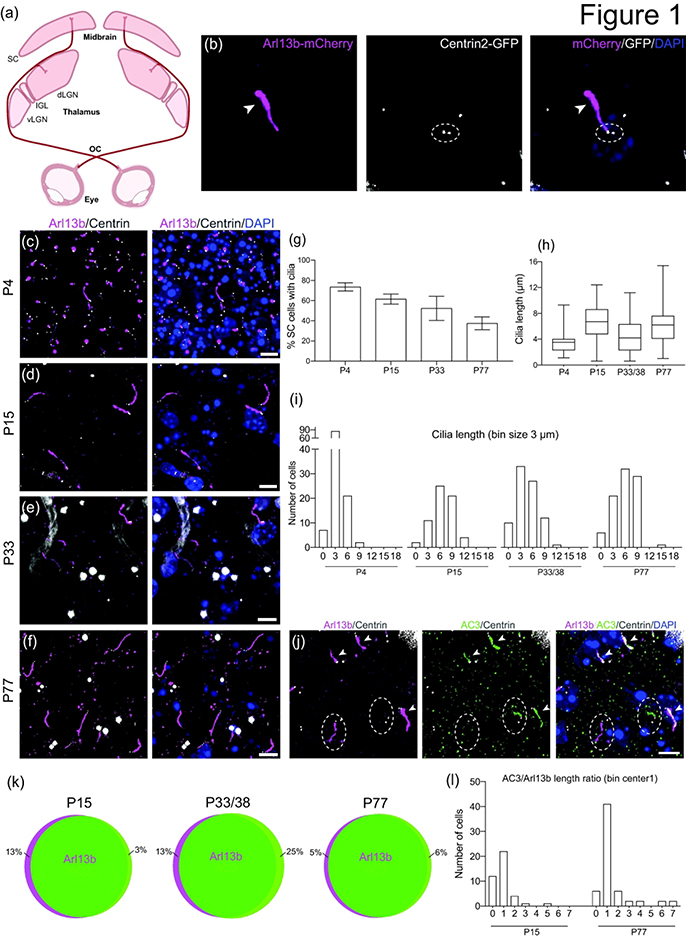
Developmental profile of cilia in the superior colliculus.
(a) Schematic of two major retinorecipient brain targets, the SC and the dLGN.
(b) Photomicrograph of primary cilia visualized using the Arl13b-mCherry; Centrin2-GFP double transgenic mouse. Arl13b (magenta, arrowhead at distal end) is expressed by primary cilia, and Centrin2 (white, dotted ellipse) labels centrioles (basal bodies). Nuclei are stained with DAPI (blue).
(c-f) Representative photomicrographs of cilia in the SC at P4 (c), P15 (d), P33 (e), and P77 (f).
(g) Bar graph shows the average ± SEM percent of ciliated cells in the SC at the indicated ages. n = 381 P4, n = 146 P15, n = 372 P33, n = 647 P77 total cells counted
(h) Quantification of cilia length of SC cells. n = 115 P4, n = 64 P15, n = 83 P33/38, n = 89 P77 total cilia measured
(i) Binned distribution of cilia length in the SC. The x-axis represents bin centers.
(j) Photomicrographs of SC cells immunostained for AC3 (green) and Arl13b (mCherry, magenta). Arrowheads indicate co-expression of AC3 and Ar13b, and dotted ellipse indicates lack of overlap.
(k) Schematic representation showing percent co-expression of Arl13b and AC3 in the SC. n = 344 Arl13b, n = 348 AC3 total cilia counted
(l) Binned distribution of AC3 to Arl13b ratio on a cell-by-cell basis in the SC. n = 40 P15, n = 61 P77 cells compared
Scale bar: All: 5 μm.
OC: optic chiasm; vLGN: ventral lateral geniculate nucleus; IGL: intergeniculate nucleus; dLGN: dorsal lateral geniculate nucleus; SC: superior colliculus

