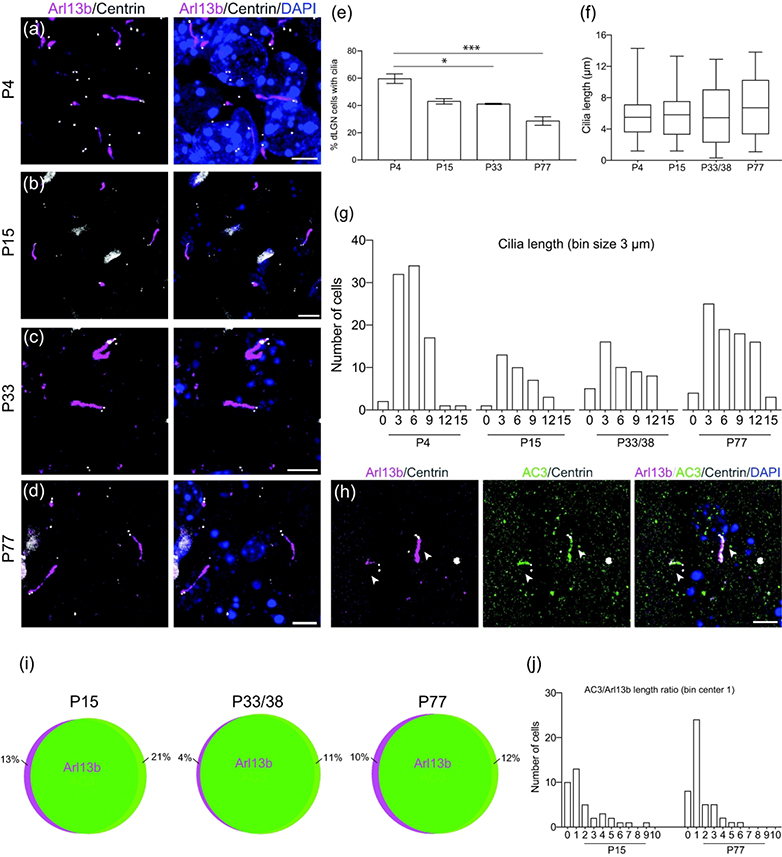
Figure 2.
Developmental profile of cilia in the dorsal lateral geniculate nucleus.
(a-d) Representative photomicrographs of cilia (Arl13b-mCherry, magenta) in the dLGN at P4 (a), P15 (b), P33 (c), and P77 (d). Centrioles labeled with GFP (white) and nuclei labeled with DAPI (blue).
(e) Bar graph shows the average ± SEM percent of ciliated cells in the SC at the indicated ages; * P<0.05, *** P<0.001; Nested ANOVA, Tukey’s multiple comparison test. n = 382 P4, n = 87 P15, n = 211 P33, n = 574 P77 total cells counted
(f) Quantification of cilia length of dLGN cells. n = 87 P4, n = 34 P15, n = 48 P33/38, n = 85 P77 total cilia measured
(g) Binned distribution of cilia length in the dLGN. The x-axis represents bin centers.
(h) Photomicrographs showing dLGN cells immunostained for AC3 (green) and Arl13b (mCherry, magenta). Arrowheads indicate co-expression of AC3 and Ar13b.
(i) Schematic representation showing percent co-expression of Arl13b and AC3 in the dLGN. n = 169 Arl13b, n = 180 AC3 total cilia counted
(j) Binned distribution of AC3 to Arl13b ratio on a cell-by-cell basis in the dLGN. n = 38 P15, n = 61 P46 cells compared
Scale bar: All: 5 μm.

