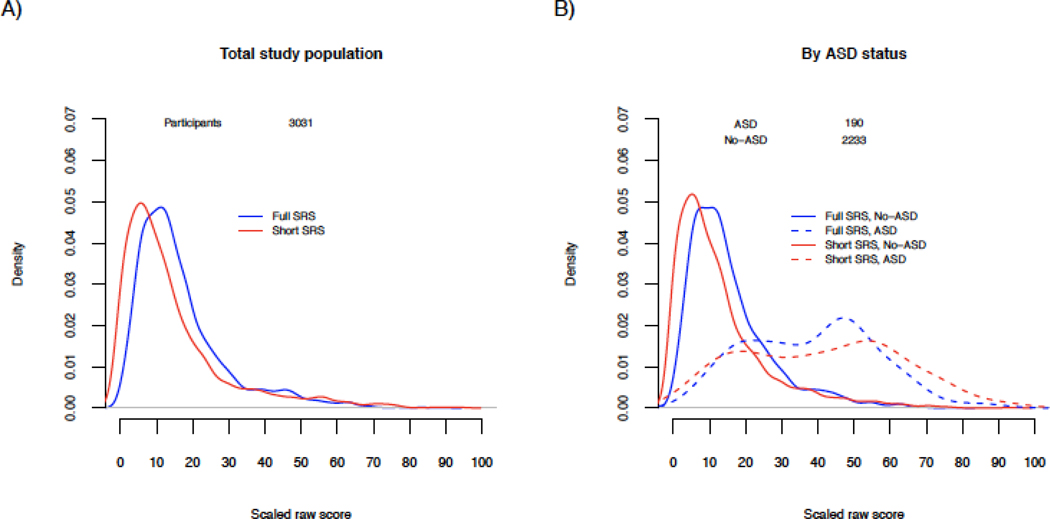
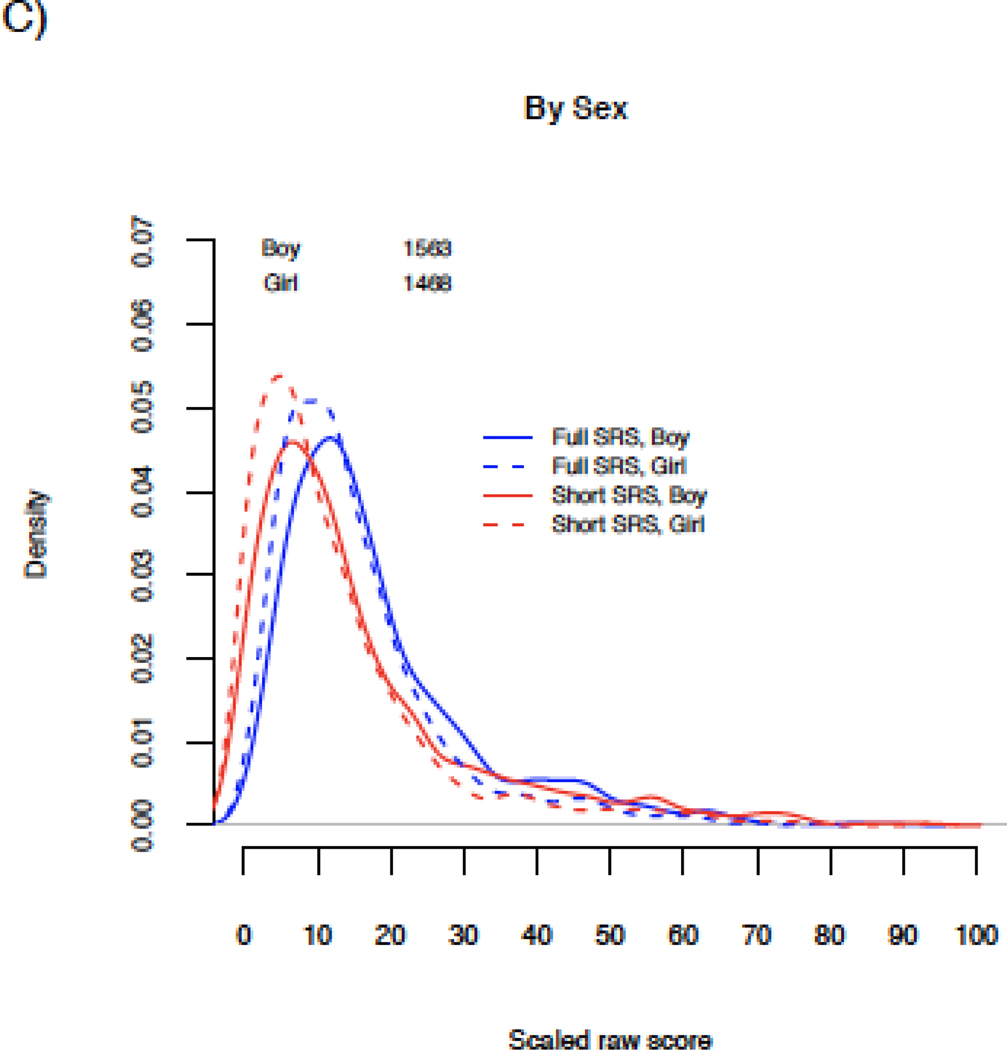
Figure 1. Distributions of full and short SRS scores in the study population.
Distributional plots of full 65-item (blue lines) and short 16-item (red lines) SRS scores in the total study population (A), by ASD status (B), by child’s sex (C) and by ASD status and child’s sex (D). Scores were scaled from 0–100 to allow for comparison on the same scale.


