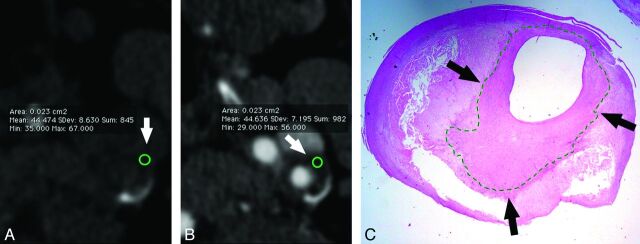
Fig 2.
A 68-year-old male patient. In CT analysis, before (A) and after (B) contrast, the carotid artery plaque is visible (white arrows) and the CPE HU value is shown. The circles, indicated by the white arrows, represent the area of the plaque that was assessed; in the basal scan, the average HU value was 44.474, whereas after administration of contrast material it was 44.636. In this case, there was no contrast plaque enhancement. In the histologic section (C), the thick fibrous cap is visible (black arrows).

