
Extended Data Fig. 5 |. Nkg7-deficiency results in increased cancer metastasis in experimental models.
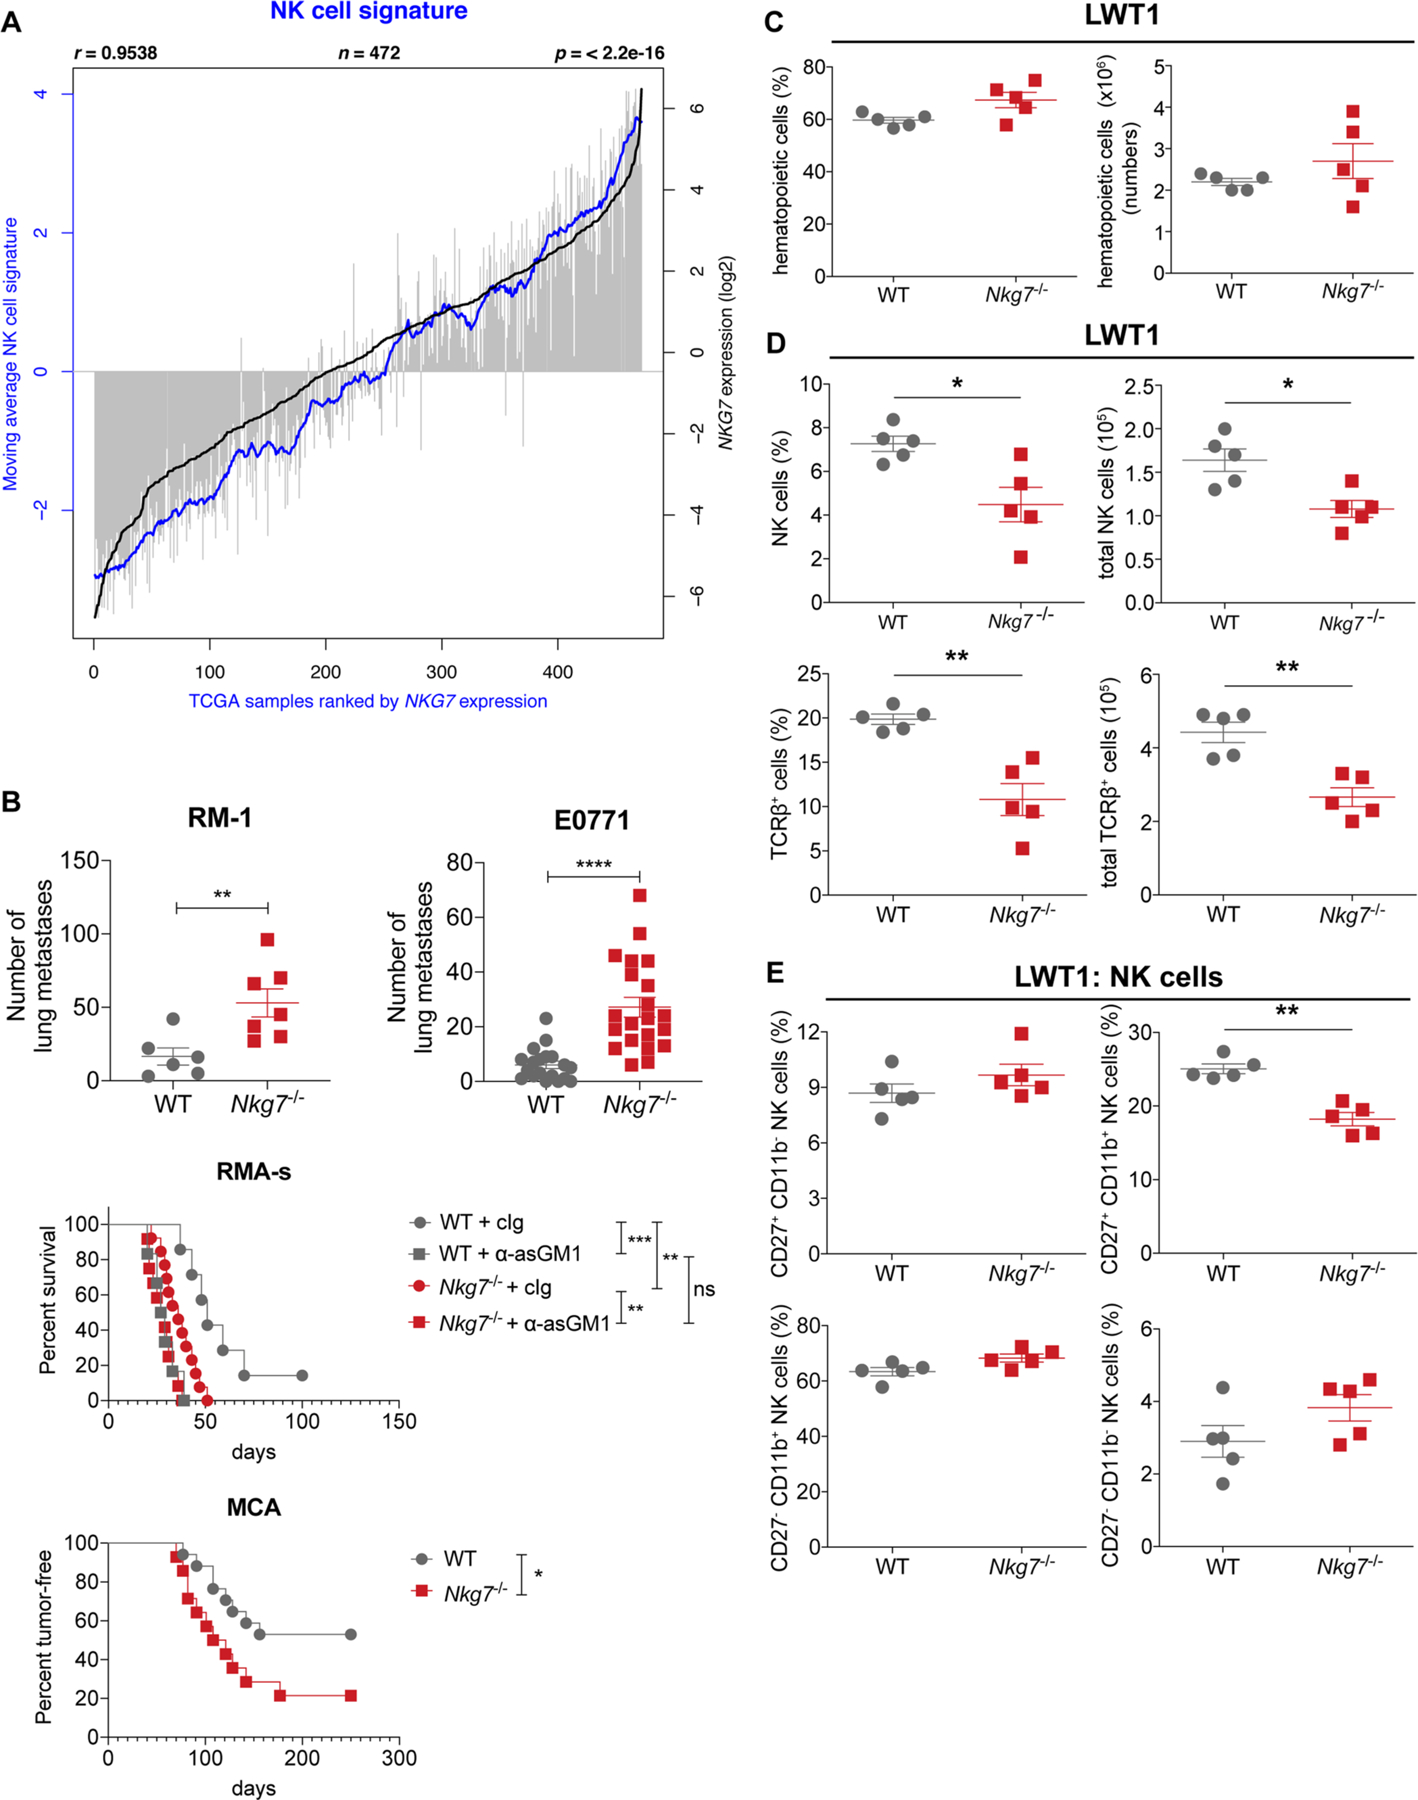
a, A correlation (r) between the moving average of a 19-gene natural killer (NK) cell signature genes and NKG7 expression in n = 472 samples from TCGA:SKCM dataset. b, The graphs indicate differences in the number of lung metastases between WT and Nkg7−/− mice following injection of RM-1 prostate carcinoma cells (n = 6 WT and 7 Nkg7−/−) and spontaneous metastasis of E0771 mammary carcinoma cells (n = 19 WT and 21 Nkg7−/−, from two pooled experiments). The survival of WT and Nkg7−/− mice treated with either cIg (n = 7 WT and 13 Nkg7−/−) or α-asGM1 (n = 6 WT and 12 Nkg7−/−) in an intraperitoneal RMA-s lymphoma model was also assessed. Statistical significance between groups was tested using the Log-rank (Mantel–Cox) test. Additionally, the difference in percentage of tumour-free mice between WT (n = 17) and Nkg7−/− (n = 14) mice following MCA-induced fibrosarcoma generation is shown. The log-rank (Mantel–Cox) test was used to determine statistical significance. ** and *** represents p < 0.01 and 0.001 respectively. ns, not significant. c, The lungs of WT and Nkg7−/− mice, injected with LWT1 cells, were assessed for differences in the frequency and total cell number of hematopoietic cells, at 14 days post-injection. d, The frequency and total cell number of NK cells and T cells were quantified in the lungs of mice injected with LWT1 cells, at 14 days post-injection. e, The differences in the frequency of NK cells at different stages of maturation, based on CD27 and CD11b expression at 14 days post-injection of LWT1 cells is shown. The data shown in C-E is representative of two independent experiments where n = 5 mice per group. The Mann–Whitney test was used to determine statistical significance. p values are shown as follows: * p < 0.05 and ** p < 0.01.