
Fig. 3 |. Nkg7 is expressed by mouse spleen and liver CD4+ T cells during L. donovani infection.
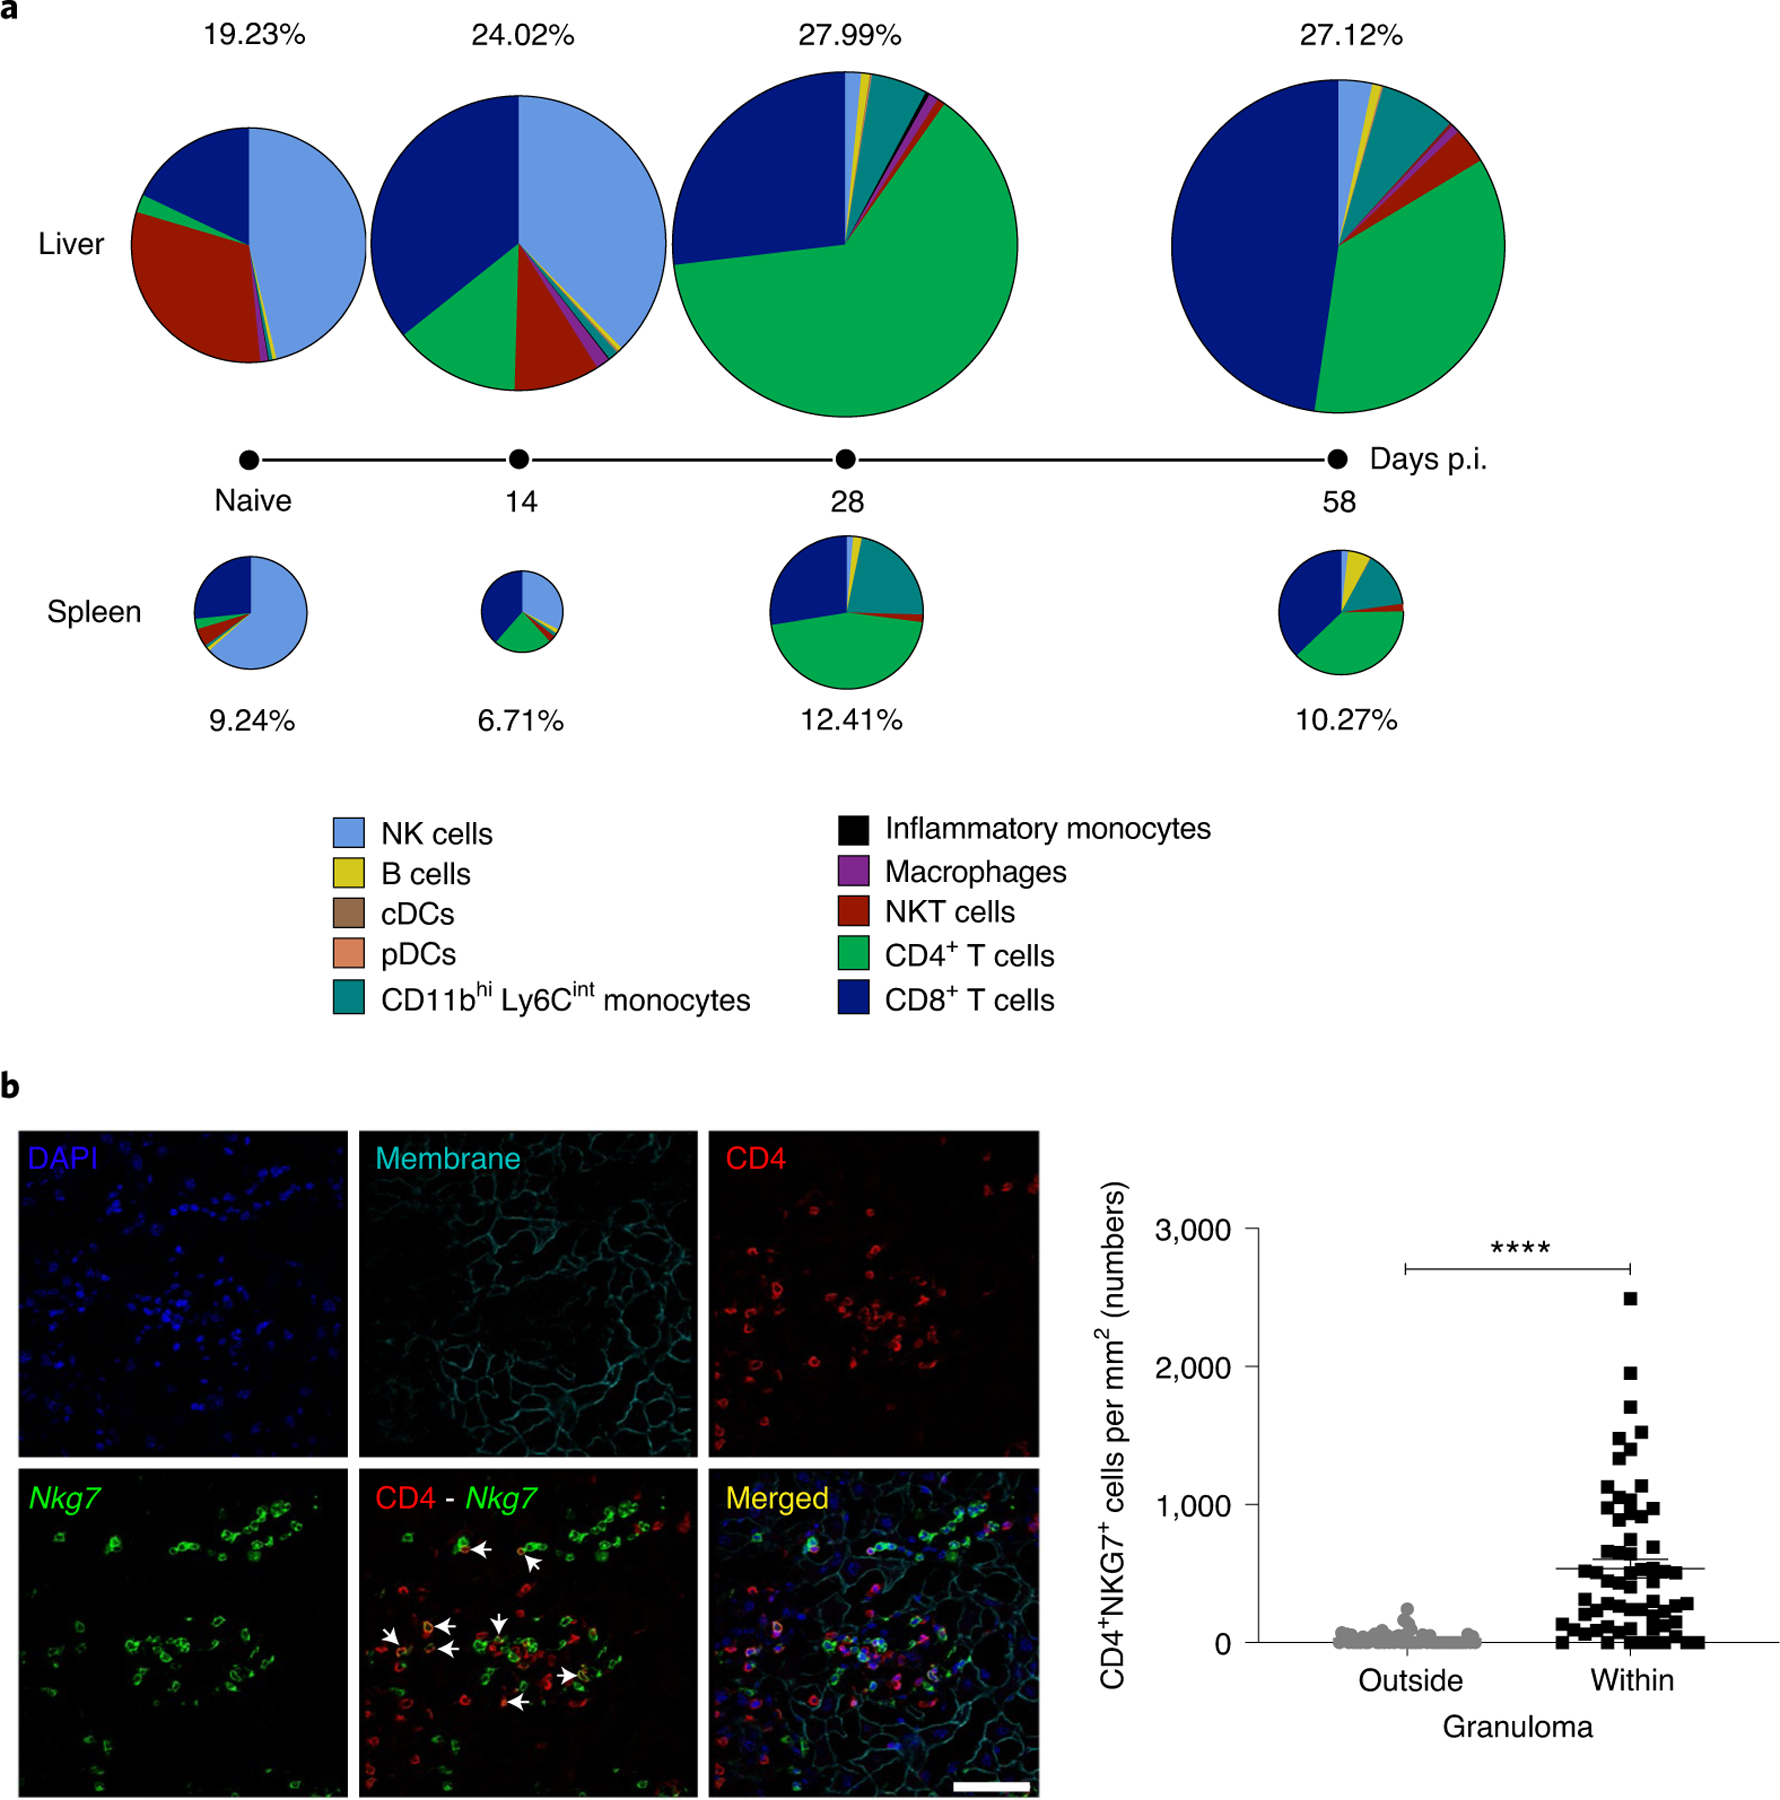
a, Nkg7 reporter mice were infected with L. donovani and the overall expression of GFP was assessed in the liver and spleen before infection (naive) and at days 14, 28 and 58 p.i. The sizes of the pie charts and the associated frequency values represent the relative percentage of GFP+ cells in the liver (above timeline) and spleen (below timeline). Within these pie charts, each slice represents the proportion of the indicated immune cell subset that made up the GFP+ population. Measurements were taken from distinct samples at each time point. The data shown are representative of two independent experiments, each consisting of n = 3 mice per genotype, per time point. cDCs, conventional dendritic cells; NKT cells, natural killer T cells; pDCs, plasmacytoid dendritic cells. b, Confocal immunofluorescence microscopy was used to determine the tissue localization of Nkg7-expressing (GFP+) cells in the liver of mice at day 28 p.i. The co-localization of Nkg7 and CD4 expression is shown in the merged image. Scale bar: 50 μm. The numbers of CD4+NKG7+ cells within inflammatory foci (granulomas), relative to surrounding tissue, are shown in the accompanying graph (right). Statistical significance was determined using the Mann–Whitney U-test. ****P < 0.0001. See also Extended Data Fig. 2.