
Fig. 4 |. Nkg7 deficiency promotes elevated parasite burdens during L. donovani infection.
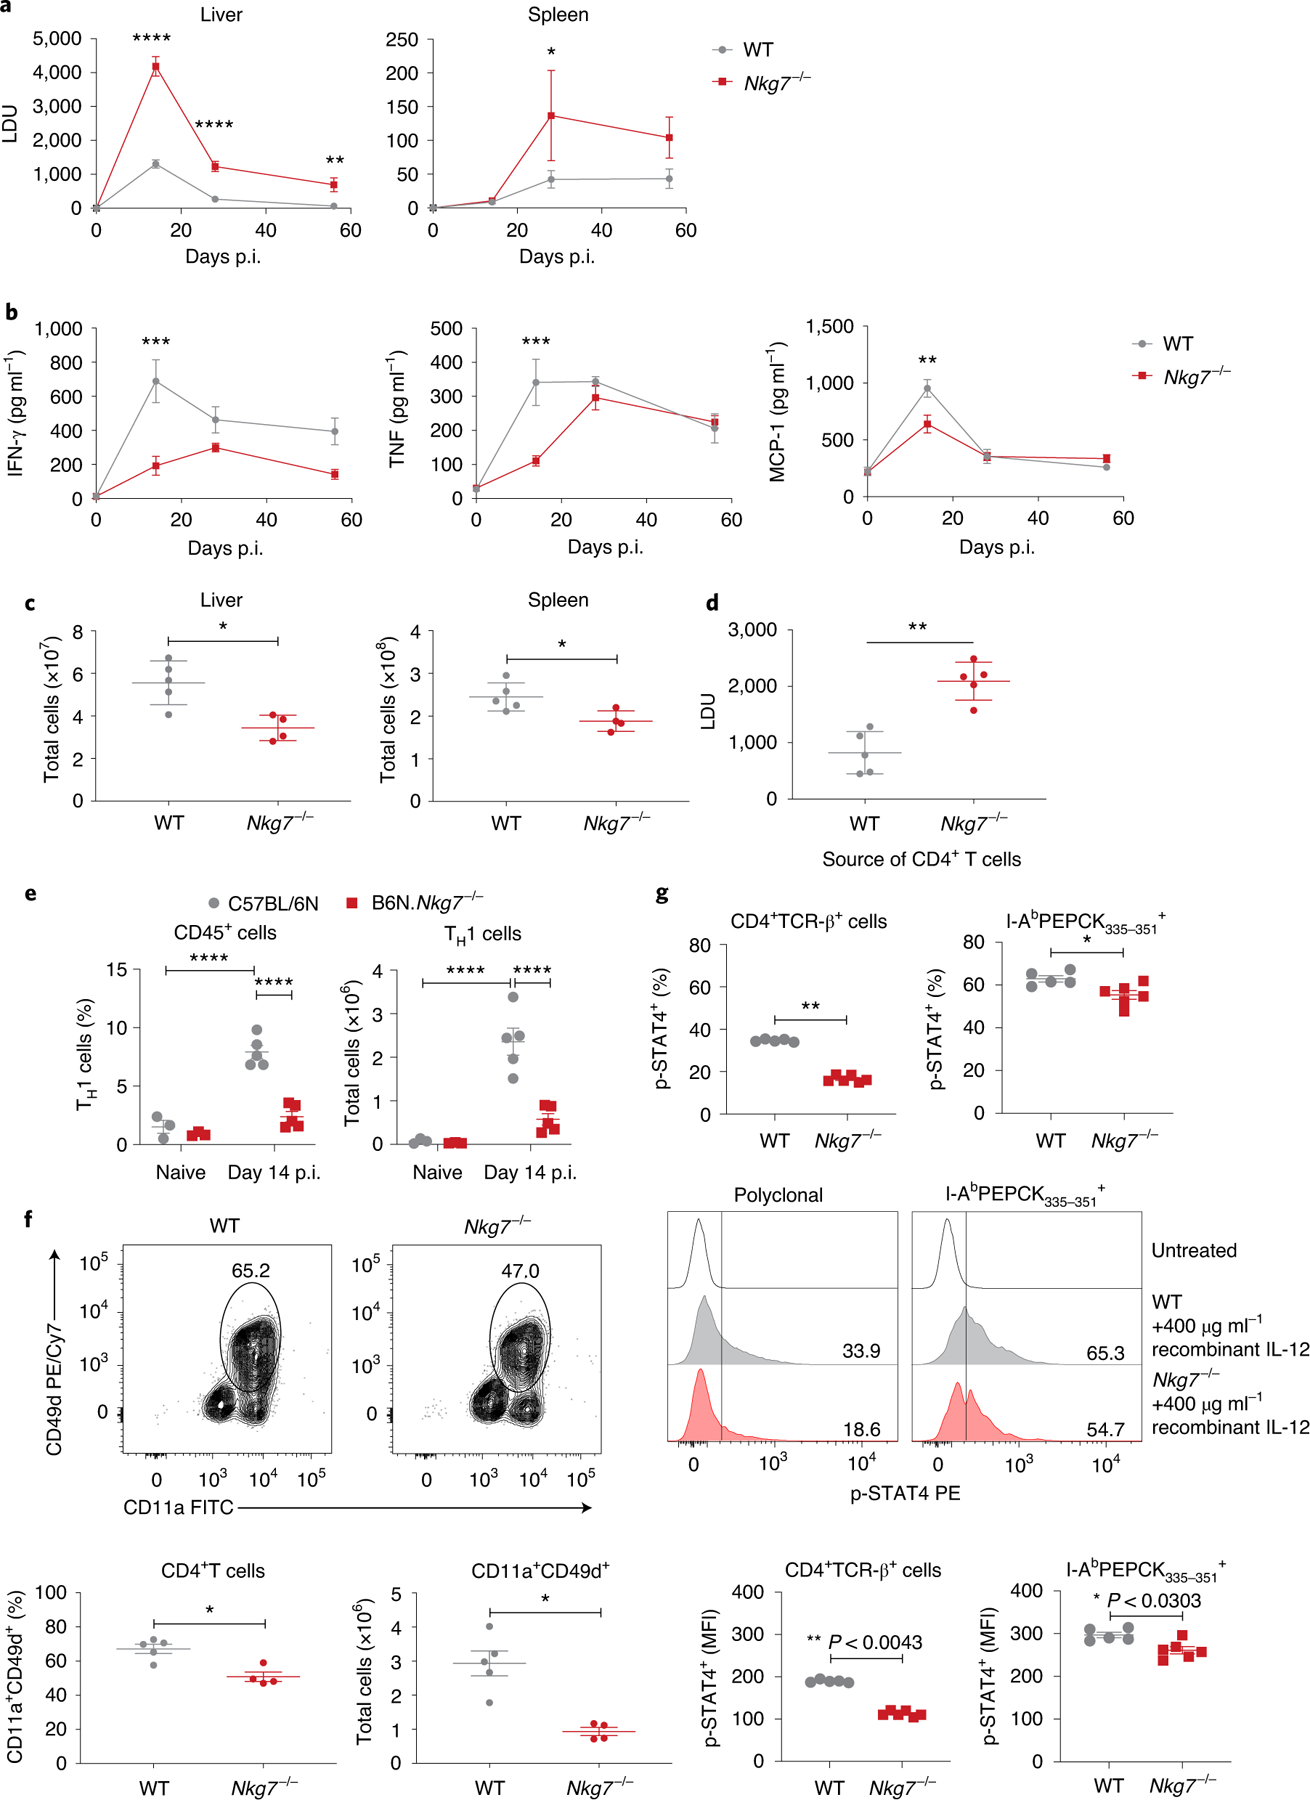
a, WT and Nkg7−/− mice were infected with L. donovani and parasite burdens were measured in the liver and spleen at days 14, 28 and 56 p.i. Statistical testing was performed using a two-way ANOVA with Šidák’s multiple comparisons test. LDU, Leishman–Donovan units. b, Quantification of serum pro-inflammatory cytokines in infected mice. Statistical testing was performed using a two-way ANOVA with Šidák’s multiple comparisons test. MCP-1, monocyte chemoattractant protein 1. c, Total number of leukocytes in the liver and spleen at day 14 p.i. Statistical testing was performed using the Mann–Whitney U-test. d, Day 14 p.i. liver parasite burdens in Rag1−/− mice that received CD4+ T cells isolated from either WT (n = 5) or Nkg7−/− (n = 5) mice. Statistical testing was performed using the Mann–Whitney U-test. e, Frequency and total number of TH1 cells (gated on lymphocytes, singlets, live cells, NK1.1-APC/Cy7−TCR-β-BUV737+, CD4-BUV395+CD8α-Alexa Fluor 700−, Foxp3-Alexa Fluor 488− and IFN-γ-APC+IL-10-PE− cells) in the livers of naive mice and infected mice at day 14 p.i. Statistical testing was performed using the two-way ANOVA with Šidák’s multiple comparisons test. f, Top: representative flow cytometry plots were gated on lymphocytes, singlets, live cells, NK1.1-APC/Cy7−TCR-β-BUV737+ and CD4-BUV395+CD8α-Alexa Fluor 700− cells. Bottom: graphs showing the frequency and total number of CD11a+CD49d+CD4+ T cells in the liver at day 14 p.i. Statistical testing was performed using the Mann–Whitney U-test. Cy, Cyanine; FITC, fluorescein isothiocyanate; PE, phycoerythrin. g, Frequency (top) and median fluorescence index (MFI; bottom) of phosphorylated STAT4 (p-STAT4) within CD4+TCR-β+ (polyclonal) and I-AbPEPCK335–351 (tetramer) PE+ cells in the liver at day 14 p.i. Statistical significance was determined using the Mann–Whitney U-test. Representative plots (middle) show the expression of p-STAT4 upon treatment with recombinant IL-12. n = 5 WT and n = 6 Nkg7−/− mice. Data are representative of two independent experiments. *P < 0.05; **P < 0.01; ***P < 0.001; ****P < 0.0001. Error bars represent means ± s.e.m. The data shown in a–c, e and f are representative of two independent experiments, each with n = 3 naive WT and Nkg7−/− mice and n = 5 WT and n = 4 Nkg7−/− mice at days 14, 28 and 58 p.i. Measurements in a and b were obtained from distinct samples at each time point. See also Extended Data Fig. 3.