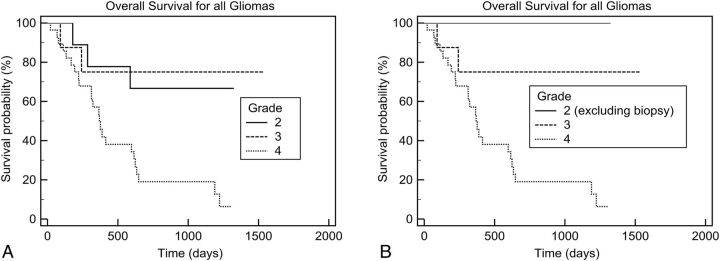
Fig 1.
Kaplan-Meier analysis of overall survival according to histopathologic grades. A, All patients (between grades 2 and 3, P = .8; and between grades 3 and 4, P = .02). B, All patients, excluding those with low-grade gliomas who had a biopsy (between grades 2 and 3, P = .2; between grades 3 and 4, P = .02).

