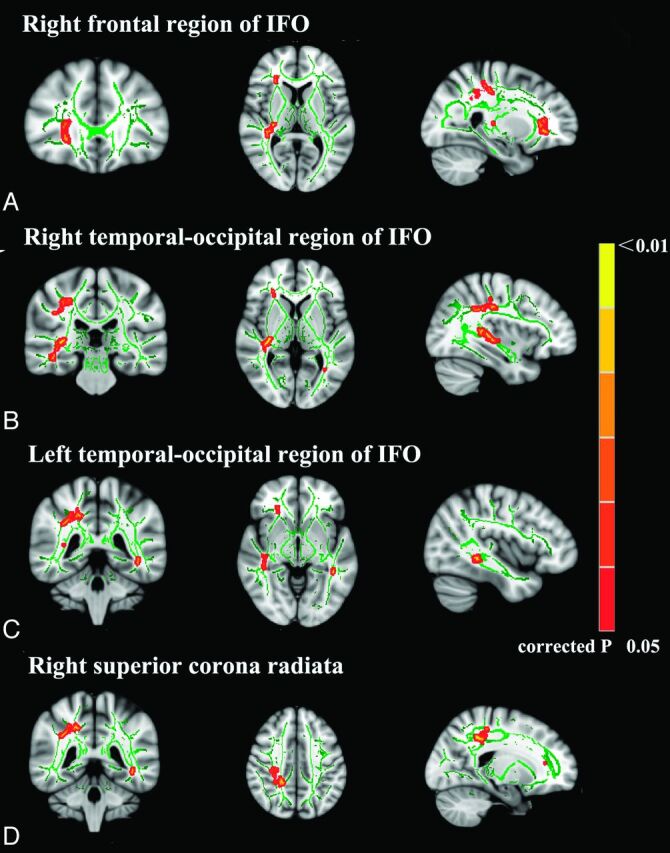
Fig 1.

TBSS analysis of FA maps. Maps of the t value (P < .05 corrected for multiple comparisons) show, in red, the areas of significantly reduced FA in chronic codeine-containing cough syrup users compared with controls. A, The frontal region of the right IFO. B, The temporo-occipital region of the right IFO. C, The temporo-occipital region of left IFO. D, The right superior corona radiata.
