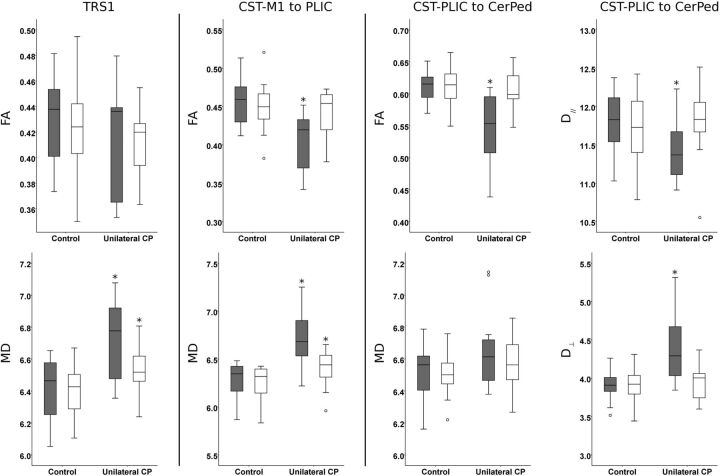
Fig 2.
Boxplots of diffusion parameters in the TRS1, CST-M1 to PLIC, and CST-PLIC to CerPed in the group with unilateral CP and controls on the lesion (gray) and nonlesion (white) sides. Diffusivity is expressed as 10−4 mm2/s. The asterisk indicates a significant difference between the group with unilateral CP and controls by statistical comparisons using the Mann-Whitney U test (2-tailed; significance level, .05).

