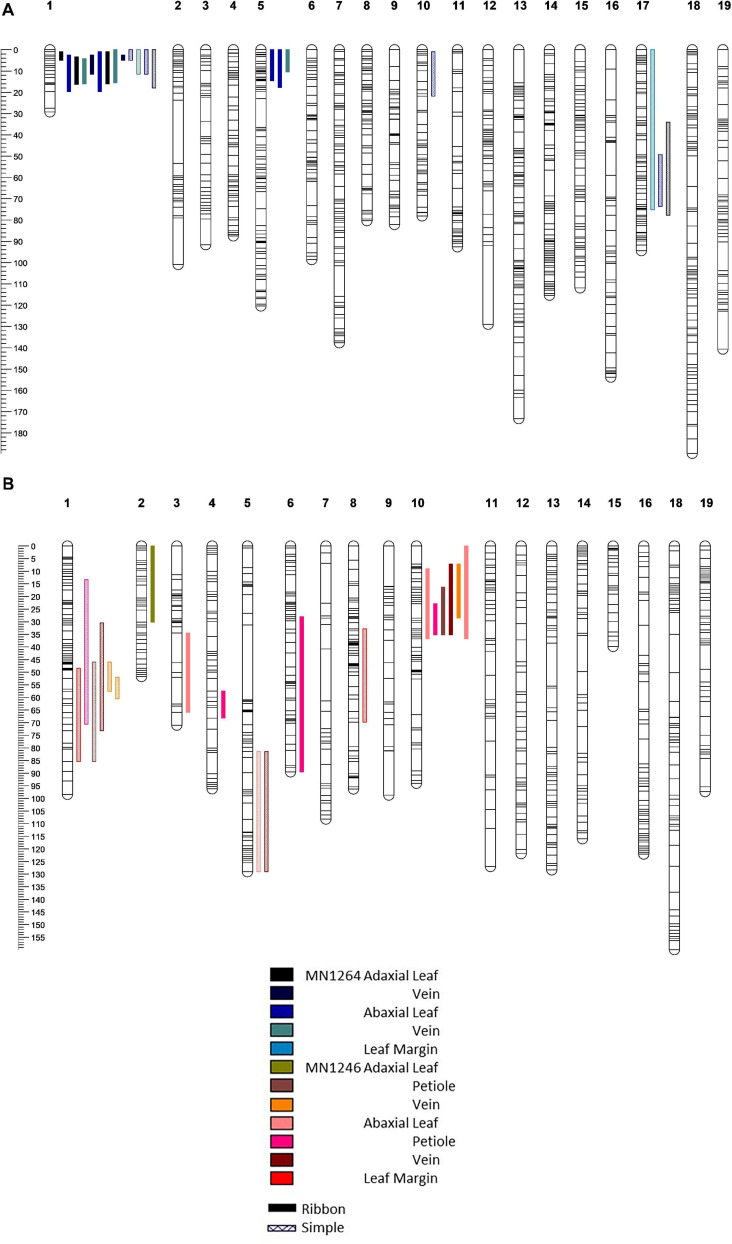
FIGURE 4.
Quantitative trait loci detected on the (A) MN1264 map and (B) MN1246 map of a hybrid grape population GE1025 of trichome density of ribbon and simple types on adaxial and abaxial leaf surfaces and various leaf positions using scanone function of interval mapping (R/qtl). Multiple bars of the same color and pattern suggest that the trait has been detected in multiple experiments (2018, 2019, or 2019 field). QTL bars represent 95% Bayesian intervals.

