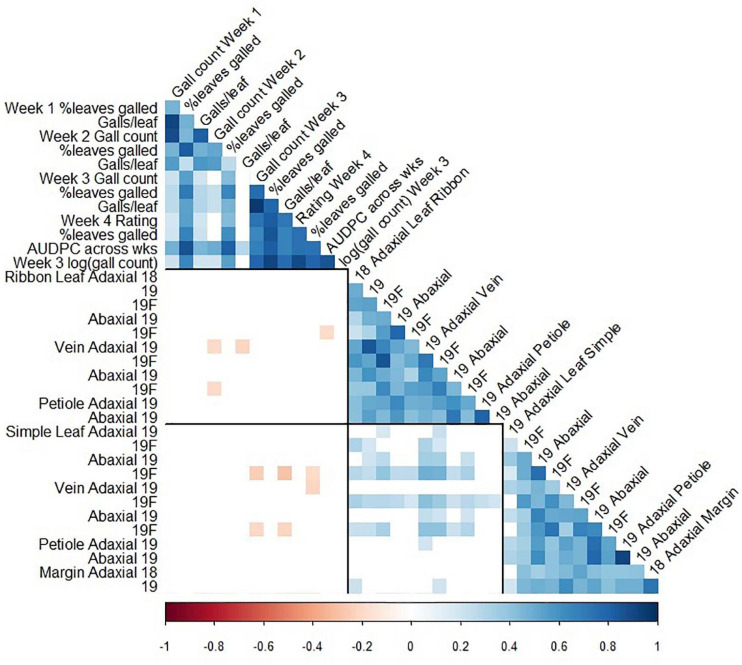
FIGURE 5.
Pearson correlation coefficients between foliar phylloxera traits (Clark et al., 2018) and trichome density traits in GE1025, a cold-hardy hybrid grape population. Blank cells: non-significant correlation coefficient; black lines divide the matrix into phylloxera traits, ribbon trichome density traits, and simple trichome density traits; 18: 2018 forced dormant cuttings, 19: 2019 forced dormant cuttings, 19F: 2019 field-grown leaves.

