Figure 1.
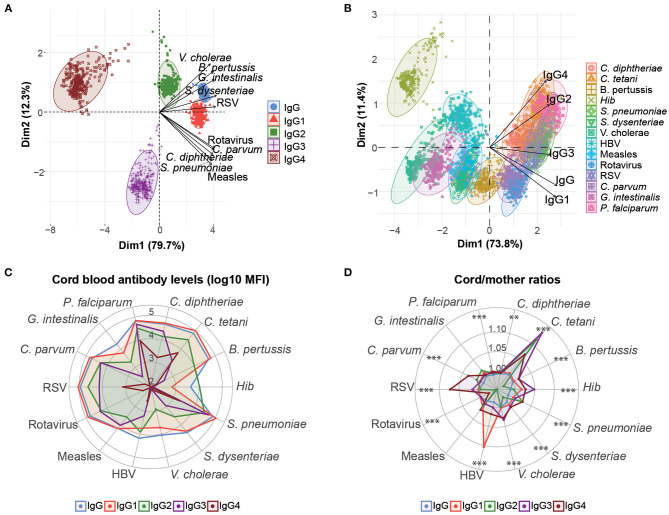
Overview of cord blood levels of IgG and IgG subclasses for all women. Principal component analysis (PCA) plots of cord IgG and IgG subclass levels against all antigens clustered by subclass type (A) and antigen type (B). The two principal components (Dim 1, Dim2) that explained the highest percentage of the variance of the data (percentage in parenthesis) were chosen for representation. The arrows in (A) and (B) represent how the variables contribute to each of the two principal components. (C) Medians of IgG and IgG subclass levels (log10 MFI) in cord blood for each antigen. (D) Medians of IgG and IgG subclass placental transfer for each antigen, represented as the cord/mother ratios. Medians of IgG subclass placental transfer for each antigen were compared by Kruskal-Wallis test and p-values were adjusted for multiple testing by the Benjamini-Hochberg approach (False Discovery Rate 5%). ***p < 0.001, **p < 0.01.

