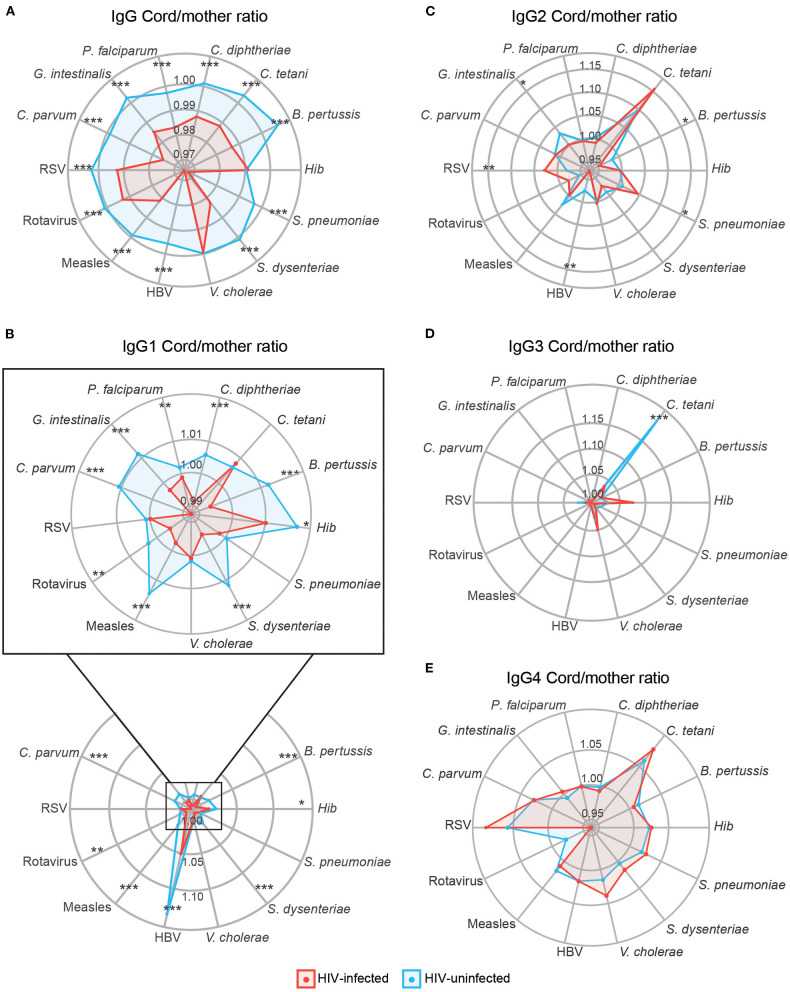
Figure 5.
Antibody placental transfer in HIV-positive and HIV-negative women. Radar charts representing the medians of each antigen antibody cord/mother ratio in HIV-positive and HIV-negative women for IgG (A), IgG1 subclass (B), IgG2 (C), IgG3 (D), and IgG4 (E). Ratios between HIV-positive and negative women were compared by Wilcoxon-Mann-Whitney test and p-values were adjusted for multiple testing by the Benjamini-Hochberg approach (False Discovery Rate 5%). Statistically significant differences between HIV-positive and negative women ratios are highlighted with an asterisk. ***p < 0.001, **p < 0.01, *p < 0.05. HIV-positive women are represented in red and HIV-negative women in blue.

