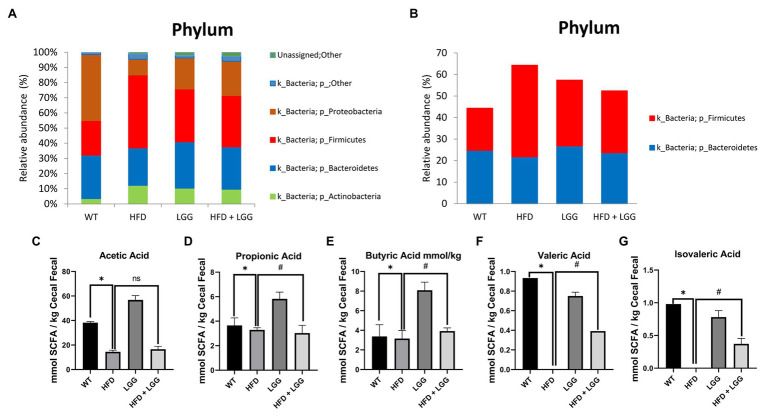
Figure 3.
Microbiota analysis of stool in all examined groups. WT, Wild-type C57BJ/L6 mice; HFD, HFD-supplemented wild-type mice; LGG, LGG-supplemented wild-type mice; HFD + LGG, HFD and LGG-supplemented wild-type mice. (A) Relative abundance of total bacteria at the phylum level in each treatment group (%); (B) Relative abundance of Bacteroides and Firmicutes at the phylum level in each treatment group (%); (C) Analysis of acetic acid; (D) Analysis of propionic acid; (E) Analysis of butyrate acid; (F) Analysis of valeric acid; (G) Analysis of isovaleric acid. All data represent means ± SD, WT vs. HFD group *p < 0.05; HFD vs. HFD + LGG nsp > 0.05, HFD vs. HFD + LGG #p < 0.05, n = 5.

