Figure 8.
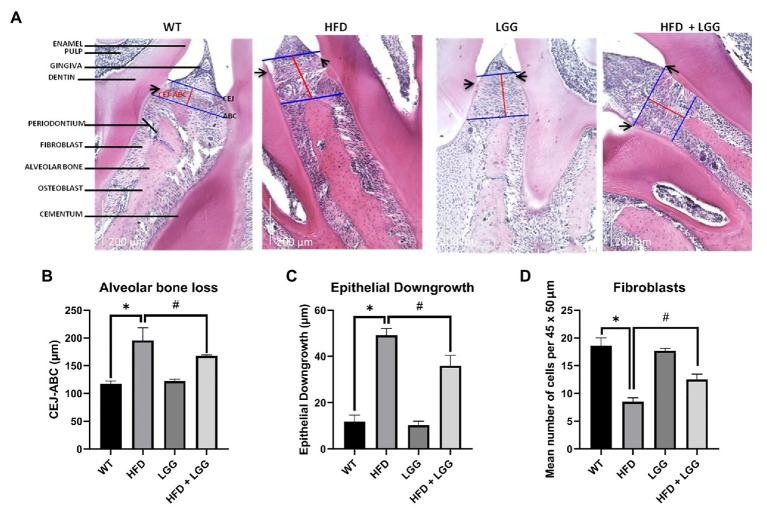
Representative images of hematoxylin-eosin (H&E) staining of periodontal tissue and histomorphometric analysis of alveolar bone loss, ED, and number of fibroblasts per 45 × 50μm. WT, Wild-type C57BJ/L6 mice; HFD, HFD-supplemented wild-type mice; LGG, LGG-supplemented wild-type mice; HFD + LGG, HFD, and LGG-supplemented wild-type mice. (A) Representative depiction of histological sections. Images were captured at 20× (200μm) magnification after H&E staining. Blue lines represent alveolar bone crest (ABC), and cement enamel junction (CEJ). Red lines represent the alveolar bone loss. Black arrows show the apical extent of the epithelial downgrowth (ED). (B) Alveolar bone-loss was measured as the distance between the CEJ and the ABC. (C) ED was defined by measuring the distance from the cementoenamel junction (CEJ) to the apical extent of the junctional epithelium. Results are expressed in μm. (D) Bars shows mean number of fibroblasts per 45 × 50μm. Scale bars = 200μm. All data represent means ± SD, WT vs. HFD group *p < 0.05; HFD vs. HFD + LGG #p < 0.05, n = 5.

