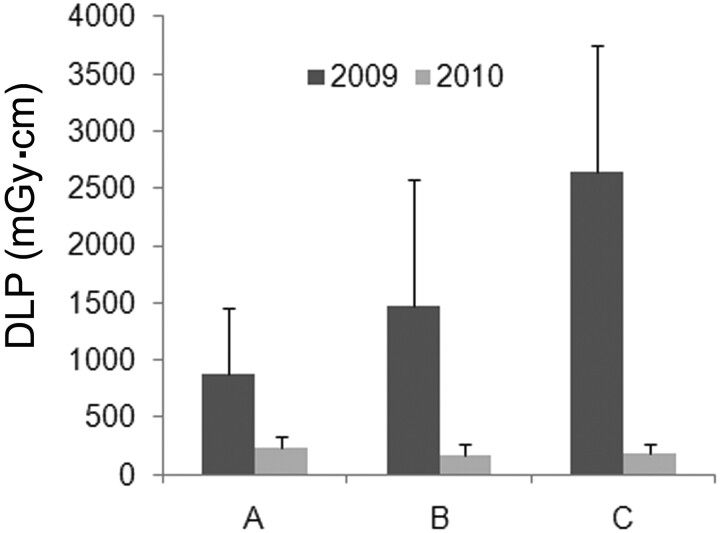
Fig 5.
Dose reductions were observed for CT-guided spinal injections by individual supervising neuroradiologists (all 2009 versus 2010 comparisons, P < .003) (bar graph = mean ± SD). Comparisons between supervising neuroradiologists in the same year showed only trends toward statistically significant differences (ANOVA, P = .167 for either 2009 or 2010) due to the large variability in total DLP.

