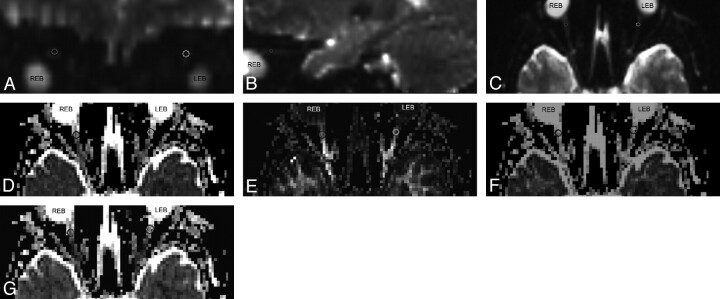
Fig 1.
A−C, DTI maps of the central section of the ON. The regions of interest are placed on the b=0 averaged images, which are defined in the coronal map (A) and adjusted in the sagittal (B) and axial (C) images obtained by using multiplanar reconstruction. D−G, Then the regions of interest are transferred onto the ADC (D), FA (E), λ‖ (F), and λ⊥ (G) maps.

