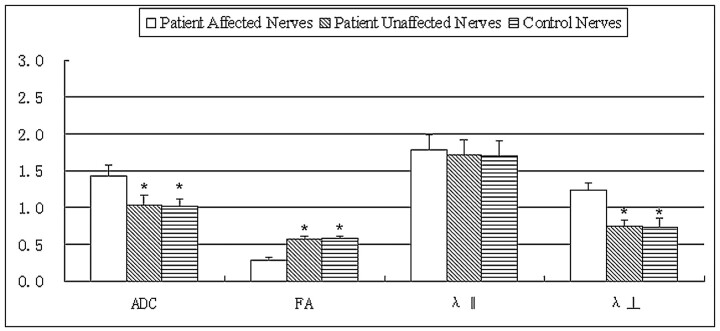
Fig 2.
Bar graphs of the ADC, FA, principal eigenvalue λ‖, and the orthogonal eigenvalues λ⊥ averaged across the affected and unaffected contralateral ONs of 26 patients with ION compared with normal ONs of 15 controls. The error bars denote the SDs across subjects. The units of the ADC, λ‖, and λ⊥ measures are in ×10−3 square millimeters per second −1. The asterisk indicates a significant difference compared with the affected nerves of patients. There is no significant difference between unaffected ONs of patients and ONs of controls in all DTI measures.

