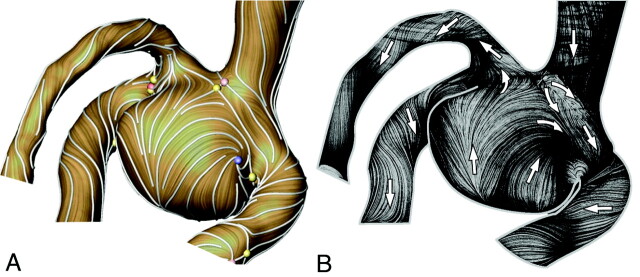
Fig 4.
A, Flow visualization of the WSS surface vector field with stream lines (white) and critical points (yellow, saddle; blue, repelling or attracting node; red, source or sink stagnation point). B, Experimental flow visualization of surface path lines in the respective model by using the Wall-PIV technique. Arrows show flow directions.

