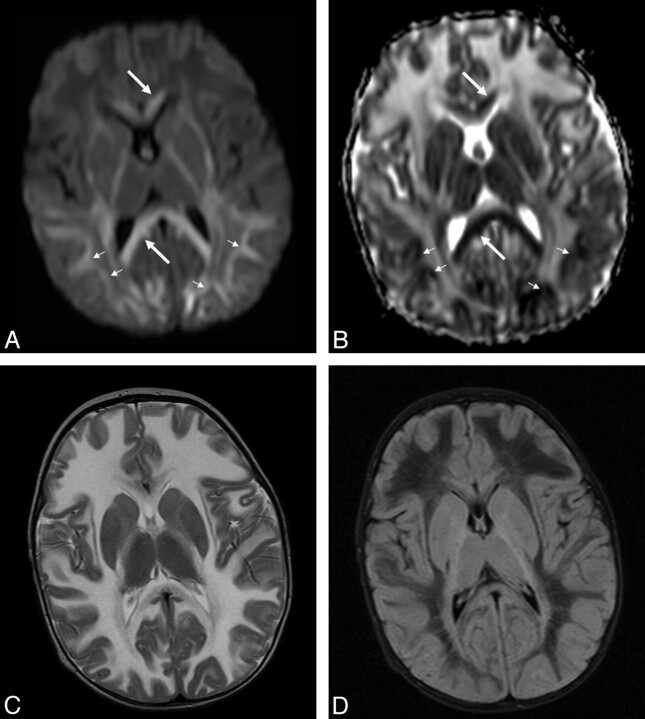
Fig 3.
Infant 4, an 8-month-old Cree boy with lethargy, hypotonia, and seizures. A and B, Axial b=1000 (A) and ADC maps (B) demonstrate regions of diffusion restriction in the corpus callosum (white arrows) and posterior subcortical U-fibers (small white arrows). C and D, T2 (C) and FLAIR (D) images are provided for comparison.

