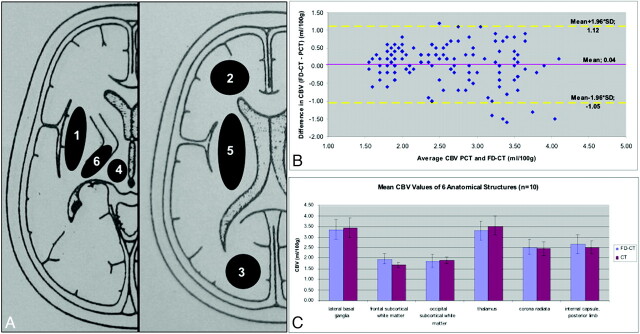
Fig 1.
A, Regions of interest for CBV measurements: 1) lateral basal ganglia; 2) frontal subcortical white matter; 3) occipital subcortical white matter; 4) thalamus; 5) corona radiata; 6) internal capsule, posterior limb. B, Bland-Altman plot displays slightly higher FD-CBV values (0.04 mL/100 mL) in comparison with CTP. C, Mean CBV values and SDs of the 6 regions of interest show only minimal deviations.

