
Fig 2.
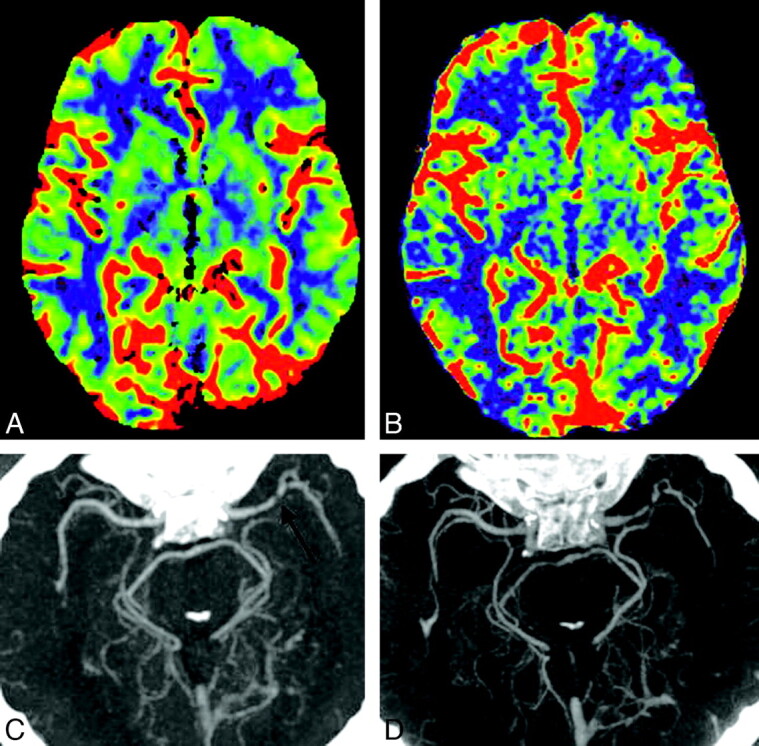
CT (A) and FD-CT (B) show the good correlation of CBV color maps. CTA (C) and FD-CTA (D) display a high-grade stenosis (black arrows) of the left MCA (patient 4). Note the perfect delineation of this high-grade stenosis in FD-CTA.
Official websites use .gov
A
.gov website belongs to an official
government organization in the United States.
Secure .gov websites use HTTPS
A lock (
) or https:// means you've safely
connected to the .gov website. Share sensitive
information only on official, secure websites.
CT (A) and FD-CT (B) show the good correlation of CBV color maps. CTA (C) and FD-CTA (D) display a high-grade stenosis (black arrows) of the left MCA (patient 4). Note the perfect delineation of this high-grade stenosis in FD-CTA.