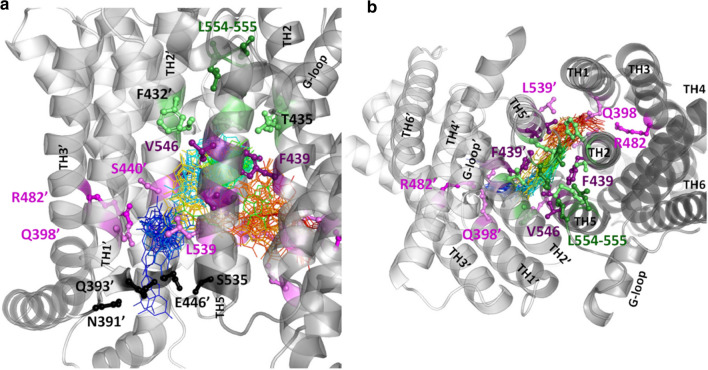
Fig. 4.
The movements of the substrate, uric acid along the translocation pathway. In an equilibrium simulation with the inward-facing ABCG2 structure (PDBID: 6HCO) in the presence of uric acid molecules, a single uric acid molecule entered Site 2′ (a pocket between TM1, TM2, and TM3 in chain B, magenta and violet sticks) from the cytosolic region (black sticks). Uric acid moved forward from Site 2′ (R482′) to Site 3 between TM2, TM2′, TM5, and TM5′, finally to Site 2 at the opposite side in chain A. Line colors of blue-green-yellow–red correspond to uric acid and encode increasing simulation time points; deep purple: N436, F439, T542, and V546; light green: F432, T435, T538, and M549; green: Leu-valve, gray: transmembrane helices; a side view; b top view from the extracellular space

