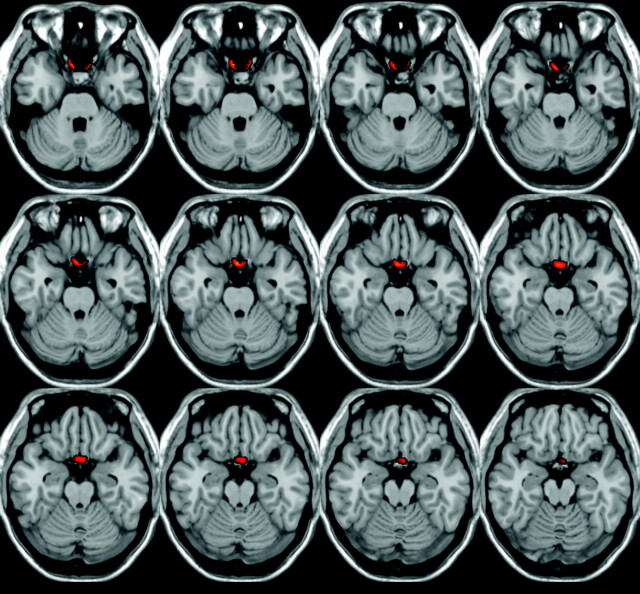
Fig 2.
VBM results for differences in WM volume between patients with POAG and disease-free control subjects. The results of the voxel-based morphometry analysis for differences in WM volume are superimposed on an axial T1-weighted brain template. The color scale encodes areas of significant differences in WM volume between patients with POAG and control subjects. Color represents regions of WM atrophy in patients with POAG. Statistically significant differences were found only in the axial images.

