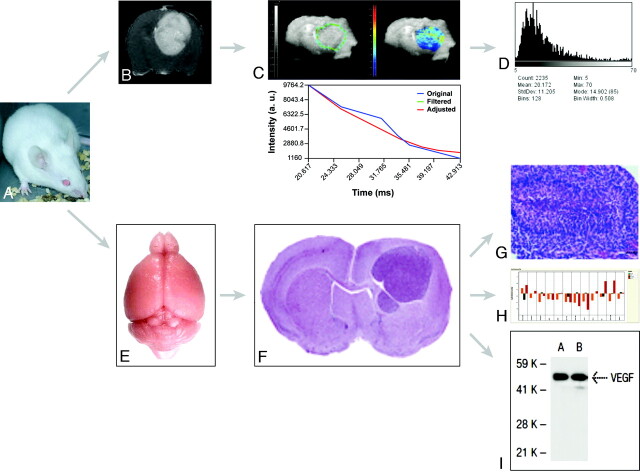
Fig 2.
Flow chart for integrated MR imaging, histology, and genomic and proteomic approaches in models of HGG. A, Representative Swiss mouse. B, Gadolinium-enhanced axial T1-weighted image shows an implanted Gl261 HGG. C, Parametric T2*map of the tumor in B. D, Parametric histogram of T2* values of C. E, Isolated normal brain from a representative Swiss mouse. F, Representative hematoxylin-eosin–stained section across a formalin-fixed paraffin-embedded mouse brain carrying an implanted HGG. Reproduced from Lal et al17 with permission from the Journal of Neurosurgery Publishing Group. G, Microscopic view (×40) of a fixed and stained section across an HGG (small black bar on the lower right corner represents 50 μm) shows pseudopalisading necrosis characteristic of HGG. Reproduced from Collier et al18 with permission from the American Association for Cancer Research. H, Gene-expression profiling (RT qPCR results) from a representative Gl261 HGG. I, Representative VEGF-A protein expression as detected by Western blot analysis.

